Provider Reimbursement System
View Adobe Acrobat Version | Download Adobe Acrobat Reader
Letter to Mental Health Stakeholder, June 2007
Table of Contents
Public Consulting Group, Inc. could not have conducted this study or produced this report without the help and support of a number of individuals and organizations. It is with gratitude that we acknowledge the following people and institutions:
Mr. Barry Brauth of the New York State Office of Mental Health played a critical role in helping us gather necessary data and in providing guidance throughout the project. Thanks also to Martha Schaefer Hayes, Deputy Commissioner of the Office of Financial Management, for her support, to the division staff, including Joyce Billetts and Gwen Diamond, and to all other New York State staff who met with us and worked to provide us with data.
We appreciate the time and effort of all the individuals who attended the two stakeholder meetings on January 3 and 5. Attendees represented the following organizations: Behavioral Health Services North, Builders for the Family & Youth of the Diocese in Brooklyn, Inc., Children’s Aid Society, Coalition of Behavioral Health Agencies, Inc., Community Health and Behavioral Services, Conference of Local Mental Hygiene Directors, Inc., Family Counseling Center of Fulton, Federation of Mental Health Centers, Inc., Greater New York Hospital Association, Healthcare Association of New York State, Institute for Community Living, Inc., Long Island Consultation Center, Inc., Mental Health Providers of Western Queens, Inc., New York Association of Psychiatric Rehabilitation Services, New York City Health and Hospitals Corporation, New York Psychotherapy and Counseling Center’s, New York State Council for Community Behavioral Healthcare, Northside Center for Child Development, Northwest Community Mental Health, Putnam Family and Community Services, Inc., Rockland County Department of Mental Health, Schenectady County, St. Mary’s Hospital (Amsterdam), St. Vincent’s Catholic Medical Centers, and Upstate Cerebral Palsy.
- We also appreciate the willingness of the following providers to host us on our provider visits:
- Bleuler Psychotherapy Center, Inc.: Executive Director John Rossland
- F.E.G.S: Senior Vice President Amy Dorin and Chief Operating Officer Jonas Waizer
- Institute for Community Living, Inc.: Chief Operating Officer Stella Pappas and Associate Chief Financial Officer William Adler
- Builders for the Family & Youth of the Diocese in Brooklyn: Executive Director Donna Corrado
- Metropolitan Center for Mental Health: Executive Director Andrew Pardo
- St. Vincents Catholic Medical Centers: Kim Pagan, Vice President of Finance
- Horizon Health Services: Executive Director Anne Constantino
- North Star Behavioral Health Services/Citizens Advocates: Director Jim Brooks
In addition to those named above, many other staff members from each of the providers participated in our visits, and we thank them all. Their input proved invaluable to this study.
Executive Summary
The 2006-2007 Enacted Budget directed New York State Office of Mental Health (NYS OMH) to conduct a study of the mental health reimbursement system. The budget language stated:
For services and expenses associated with a study to review the current system of financing and reimbursement of mental health services provided by clinic, continuing day treatment and day treatment programs licensed under article 31 of the mental hygiene law, and to make recommendations for changes designed to ensure that the financing and reimbursement system provides for the equitable reimbursement of providers of mental health services and is conducive to the provision of effective and high quality of services. Such study shall be coordinated by the commissioner of the Office of Mental Health and shall be completed and submitted to the legislature no later than March 1, 2007.
Public Consulting Group, Inc. (PCG) was engaged by NYS OMH to conduct this study. New York State currently uses a funding and reimbursement methodology for their clinic, continuing day treatment (CDT) and day treatment programs that includes the use of a regional fee schedule for recognized services (the base rate) with the addition of provider specific supplemental payments (known as add-ons) to compensate providers for the costs of providing services. This system was established in 1991, and at the time it was a creative solution that provided the funding needed to meet the growing demand for and cost of these services. With the passage of time, however, the existing funding and reimbursement system has become antiquated and is not able to keep pace adequately with the needs of the providers and their consumers.
Based on this study, PCG has concluded that the current system of financing outpatient mental health services using an add-on structure should be replaced with a more equitable and more rational system of payment. The current system is outdated, inequitably funded and is based on a rate structure that has outlived its usefulness.
The COPs/Non-COPS structure that has been used for nearly two decades has resulted in provider payments that vary considerably (by over $200 a unit after cost outliers are removed), and these payment variations cannot be uniformly explained by differences in case mix or service intensity. In fact, at times the same service is reimbursed at different rates based solely on the facilitys license. Overall, reimbursement for facilities licensed by NYS OMH is divorced from reimbursement for facilities providing the same or similar services under licenses from the Department of Health (DOH), the Office of Alcoholism and Substance Abuse Services (OASAS) or the Office of Mental Retardation and Developmental Disabilities (OMRDD). This discrepancy in reimbursement methodology is particularly striking given that, in some instances, the same individuals are served by all of these facilities. The irrational nature of the current reimbursement system is in part of a function of reimbursement and licensing freezes around which providers have learned to work.
What is needed is a complete overhaul of the current payment system. However, no changes to the reimbursement methodology for outpatient mental health services can be done without considering New York States overall health care policy goals. In writing this report, we understand that our study is narrowly focused, but that any solutions would have to include a much broader perspective of the states Medicaid reimbursement system as a whole.
NYS OMH Service Delivery Models and Reimbursement Rates
The current Medicaid reimbursement structure for outpatient mental health services includes basic components: a Medicaid base rate and supplementary payments. The base rate is determined in one of two ways. For free standing providers (Article 31) it is determined regionally with providers in the New York City metropolitan area receiving a higher rate than providers in Upstate New York. Hospital (Article 28) base rates are determined on a cost related, provider specific basis composed of an operating component capped at $67.5 and an uncapped capital component. There are three main supplementary payments, or add-ons:
- Comprehensive Outpatient Programs (COPs),
- Non-COPs, and
- Community Support Programs (CSP).
This study focuses on the COPs and Non-COPs add-ons. However, the State also needs to update the way the base rate is developed as well. The designation of COPs or Non-COPs plays a significant role in determining a providers available revenue and in many cases its expenditures. Historically, COPs providers were the providers who received state aid in the 1980s. Today, the COPs designation translates to increased revenue and increased regulatory obligations. COPs providers must adhere to nine specific regulations that include the provision of free care and 24 hour services and the ability to intake consumers from inpatient or hospital settings with 5 business days.
Non-COPs providers are those who did not receive state aid in the 1980s. While they do not have to adhere to the same regulations as COPs providers, they are only expected to adhere to four (4) of the nine (9) specific regulations for which they receive a Non-COPs add-on to help them cover the cost of providing mental health services. The Non-COPs add-ons tend to be nominal compared to the COPs add-on.
Community Support Payments (CSP) fund community based mental health programs that serve the severely and persistently mentally ill (SPMI) population. CSP add-ons deliver community supports such as psychosocial clubs.
Whether they are provided in clinic or hospital settings, outpatient mental health services in New York State include the following program models:
- Clinic treatment: Traditional outpatient therapy for children or adults, which includes clinical support services, health screening, symptom management and medication therapy.
- Continuing Day Treatment (CDT): Mental health services for adults who need help developing the skills necessary for independent living; CDT visits last longer than clinic visits and occur more often.
- Day Treatment: Mental health services for children who need help acclimating to or re-entering a traditional education setting. Day Treatment visits last longer than clinic visits and occur more often.
The New York Medicaid State Plan authorizes reimbursement for specific services for each of these program models.
Analysis of NYS OMH Data
This report relied on several sources of quantitative data, including:
- Consolidated Fiscal Reports (CFR)
- Medicaid Management Information System (MMIS) claims data
- Institutional Cost Reports (ICR)
- Patient Characteristics Survey (PCS) Data
The main themes include:
- Clinic programs shows considerable aggregate losses of $54.5 million, while Day Treatment shows a small deficit of $2.0 million and CDT programs show gains of $5.9 million.
- Eighty nine (89%) of the deficits incurred in the clinic are attributable to 10% of the provider population. However, it is not clear if this phenomenon is due to data quality problems, actual provider performance or a combination of both.
- The ninety percent of the provider population represents 309 programs and accounts for $11.0 million in deficits.
- COPs providers generate almost twice as much revenue per unit as non-COPs providers but COPs providers expenditures are twice as high leading to slightly greater losses and higher costs than Non-COPs providers.
- COPs providers in the clinic program represent 80% of the providers, render 80% of the services but generate 90% of the Medicaid revenues due to the COPs supplemental payments. Although this is the case, the COPs providers have the highest deficits.
- Variances in revenue and costs are significant between COPs and Non-COPs when comparing clinic programs, but are not as significant in Day Treatment or CDT Programs, which do not utilize an add-on reimbursement rate.
- Net gains and losses are heavily influenced by where a provider is located.
- Variations between providers costs and revenue indicate huge differences in how providers are controlling costs and billing revenue sources.
- The effects of size and location on provider costs and revenue vary and do not follow a consistent pattern.
Findings and Conclusions
Based on our review, PCG has concluded that the current system of financing and reimbursement must be overhauled completely. Changes to the system should be guided by the physical and behavioral needs of Medicaid enrollees receiving services and the research about the most effective models of care. Any restructuring should be done with the goal of creating a system that is more equitable across the provider community and aligned with the states mental health and overall health care goals. Our Findings and Conclusions are summarized below.
Findings
Finding 1: Reimbursements, costs and deficits vary substantially among providers.
There is substantial variance in the reimbursements providers receive and in the costs and deficits providers report. The reimbursement variance is attributable to the COPs, Non-COPs and CSP add-ons as well as the inconsistent COLA adjustment for some providers. Specifically, reimbursements for services vary by hundreds of dollars from provider to provider:
- Continuing Day Treatment, 1 hour service for units 1-50: $12.65 to $225.32
- Clinic Regular: $49.64 to $567.25
- Day Treatment, full day - $70.93 to $332.83
Costs per unit of service vary considerably with some providers expenses reported as being thousands of dollars higher than those of other providers. Even when the top 5% and bottom 5% outliers are removed from the analysis, because we question the accuracy of the reported data, expenses vary over $200 per unit.
The average cost per unit follows:
- Continuing Day Treatment-$19.28
- Clinic Regular-$122.55
- Day Treatment-$67.40
Provider gains and deficits vary considerably with some providers reporting over $13 million in losses while others report over $2 million in net gains. While some of this variation may be attributable to poor data, when outliers are removed losses and gains ranged from ($1.5 million) to $2.3 million.
Finding 2: The current reimbursement system is complex and is not transparent or easily understood by providers.
Providers feel the system is arbitrary, has negative cash flow impacts on their business practices and is difficult to manage. For example, providers are required to estimate and set aside any over allocation of rate supplement funds that could be recouped by the state on an annual basis.
Finding 3: New York State collects a significant amount of detailed data from providers.
Through the CFR and ICR reports and the Patient Characteristics Survey, the State collects a significant amount of data from providers that can be utilized in the development of a reimbursement methodology and later in ongoing reimbursement updates. Although the infrastructure is comprehensive, there are some issues of data quality and comparability that would need to be addressed if the data were to be used for this purpose.
Finding 4: Providers recognize the importance of Quality. Providers are conducting various continuous quality improvement (CQI) initiatives and are measuring various outcomes.
Many providers are taking part in the states continuous quality improvement (CQI) initiative for which they receive additional reimbursement. Additionally, many providers have established their own quality initiatives. The degree to which quality measures are implemented varies by provider, with many larger providers employing a dedicated quality assurance staff and smaller providers relying on administrators to fulfill that role.
Finding 5: There are several cost drivers that significantly impact clinic, CDT and day treatment.
Provider costs are impacted by many factors that include, but are not limited to: geographic location, client need and characteristics, staffing models, productivity and no-show clients, provider size, and the provision of non-reimbursable services, as well as serving Medicaid Managed Care and uninsured consumers.
Finding 6: In total there was a 50.7 million net deficit for the agencies and programs included in this study. (346 out of approximately 455 in the New York State mental health reimbursement system).
Providers reviewed reported an overall program deficit on their cost reports. The $50.7 million includes state and local net deficit funding of $25 million reimbursed to the providers included in this study. (The deficit is $75.7 million when the state and local net deficit revenue is removed.) Even when the outlier providers (10% of the top) are excluded, the remaining 90% of providers have an $11.4 million net deficit for all of the programs combined. The loss appears to be based on a combination of uncompensated care and limits and rate inadequacies by Medicare, managed care companies, and other insurance programs.
Finding 7: Providers are performing Medicaid outreach services to increase client enrollment in Medicaid.
Although they are not required by NYS OMH and are not currently billed to Medicaid administration, some providers perform outreach services to clients, including providing Medicaid informational material, assessing clients for Medicaid eligibility, and helping set up appointments with Medicaid eligibility workers.
Finding 8: New program funding, changes to state law, and changes to the SCHIP program will reduce the size of the un- and underinsured population.
Recent changes in funding, law and policy in New York State will impact the availability of funding to support mental health services. Timothys law the expansion of Child Health Plus and the removal of administrative obstacles to Family Health Plus will increase the amount of private insurance and Medicaid/State Childrens Health Insurance Plan coverage available to mental health clients and thereby decrease the pressure of the un- and underinsured population on mental health providers.
Finding 9: Providers cited difficulty in recruiting appropriately licensed staff, particularly in specialty areas.
Providers say they have a difficult time recruiting appropriately licensed staff, particularly in specialty areas such as childrens psychiatry and bilingual staff. Providers cited low salaries/salary competition, tough work environments and fewer licensed providers than actual demand as impacting their ability to recruit and retain staff. The staff recruitment problem is exacerbated among providers who serve large Medicaid Managed Care populations because many Managed Care Organizations have higher standards for provider qualifications than the state Medicaid program. These problems are compounded by the fact that rates have not kept pace with increasing costs.
Finding 10: The existing reimbursement system has not kept up with changes in the delivery system. It does not have a process in place to adequately adjust the baseline from which funding add-ons were originally calculated.
The initial funding calculations that determined the amount of the provider-specific add-on payments were largely based on the overall financial performance and funding sources of the provider in the 1989 base year and its designation as either a COPs or Non-COPs provider. There is no mechanism within the system to rebase these add-on payments to maintain a consistent relationship between costs and funding at a provider level. As a result, inequities among like providers have become significant over an 18 year period.
Finding 11: Providers indicate that the distinctions differentiating providers have narrowed since the original funding formula was developed.
Over the years, services offered by various providers have become more comparable, consumers served and payer types have become more consistent across providers. As a result, anecdotal evidence suggests that the distinctions that originally separated some types of providers have disappeared.
Finding 12: If the resources in the existing system were redistributed, a significant increase in the clinic base rate could be financed.
The current rate structure roughly reflects the average cost of services but is disproportionately distributed. Hypothetically, an average per visit increase of approximately $70 could be supported if all current add-ons were evenly distributed.
Finding 13: Low Medicaid managed care reimbursement and the subsequent addition of the COPs add-on managed care reimbursement has eroded the financial health of providers and created a duplicative, costly state payment mechanism.
Individual providers must negotiate the Medicaid managed care rate with the managed care organization. For COPs providers, the COPs add-on amount is paid separately to the provider for outpatient services provided to a Medicaid managed care consumer. This system exacerbates financial strain on the system both by providing a reportedly insufficient payment to providers and by eliminating state savings gained through a managed care capitation.
Conclusions
As New York State moves forward in considering whether to restructure its Medicaid reimbursement methodology for outpatient mental health services, there are a number of items the state should consider. First and foremost, the state should consider how outpatient mental health services fit into the states overall health care policy objectives. Second, it should create a system that is based on validated, consistent and up-to-date data. By ensuring consistent data collection and using the most current data available, the State of New York could create a reimbursement system that is based on current costs. The state can also use this opportunity to tie the reimbursement methodology more closely to the mission and goals of NYS OMH.
The new system should also give due consideration to the following reform principles and ideas for redistribution of resources:
- Medicaid payments should address the reasonable and necessary cost of providing services to Medicaid enrollees.
- Medicaid payments must take into account the multiple needs of individuals requiring mental health services, including integration with general health care, substance abuse, and mental retardation services.
- The payment method should be built on an econometrically sounds basis, taking into account differences in provider service type, case mix, service intensity, geography and volume.
- Financial incentives must be aligned across facility licenses and settings.
- Add-on payments should be eliminated. The savings should be reinvested into a new payment structure that takes case mix into consideration and that would apply to all providers.
- NYS OMH should consider the use of more appropriate, HIPPA-compliant codes, where the type and amount of services delivered are consistent with CPT-4 definitions.
- Further consideration should be given to the development of incentive payments that tie to measurable indicators of quality, such as outcomes accountability, individualized services, and overall responsibility for the client.
- The state needs to recognize the need for indigent care and should consider developing an Indigent Care Pool, which would address issues related to net deficit financing and wrap-around services. Indigent care payments to providers should be based on the relative percentage of uninsured patients in their caseload.
I. Introduction
The 2006-2007 Enacted Budget directed New York State Office of Mental Health (NYS OMH) to conduct a study of the mental health reimbursement system. The language stated,
For services and expenses associated with a study to review the current system of financing and reimbursement of mental health services provided by clinic, continuing day treatment and day treatment programs licensed under article 31 of the mental hygiene law, and to make recommendations for changes designed to ensure that the financing and reimbursement system provides for the equitable reimbursement of providers of mental health services and is conducive to the provision of effective and high quality of services. Such study shall be coordinated by the commissioner of the Office of Mental Health and shall be completed and submitted to the legislature no later than March 1, 2007.
In December 2006, NYS OMH contracted with Public Consulting Group, Inc. (PCG) to conduct this study.
Significance of Study
Outpatient mental health services play a critical role in the overall health of individuals and in the health care delivery system. Estimates of prevalence suggest that during any given year, one quarter of the population suffers from some kind of mental health problem, including depression, anxiety and more serious conditions. Yet many people do not have access to mental health services when necessary due to multiple factors including lack of insurance coverage and the unavailability of services in some areas. Primary care physicians fill some of the gap, but they have neither the time nor, in some cases, the expertise to keep people out of jeopardy. During 2006, while over 5 million New Yorkers were on the Medicaid or SCHIP roles, only 11% received any kind of mental health service. One third of those mental claims were merely prescriptions unaccompanied by either a specialty practitioner or a mental health diagnosis.
Outpatient services are the least expensive, most highly utilized mental health services. Nevertheless they continue to be used by only a fraction of those who need them and according to a review of MMIS data, are rarely overused. Fewer than 4% of New York Medicaid recipients use more than 40 visits a year; only 1% use more than 60.
The current reimbursement system for mental health outpatient services is a complex matrix that is not working. It was crafted over time with federal and state approval and has not kept up with current needs. Care must be given to do no harm to consumers and to ensure that changes do not create an environment that results in increased homelessness, arrests, or hospitalization. This work should continue with attention given to redesigning the reimbursement system in concert with the states reform agenda.
No changes to the reimbursement methodology for outpatient mental health services can be done without considering New York States overall health care policy goals. Outpatient mental health services represent a small slice of the overall mental health landscape, which in turn constitutes only one piece of New Yorks Medicaid and health care environments. These pieces interact daily on the patient level, as co-morbidity is a significant issue for many mental health consumers. As a result, it would be imprudent to make changes to the outpatient mental health reimbursement system without looking at a more integrated financing system for Medicaid. In writing this report, we understand that our study is narrowly focused, but that any solutions would have to include a much broader perspective.
History
The Medicaid base rate for clinic, day treatment and continuing day treatment (CDT) services was developed in the early 1980s using a regional fee. The state determined a cost-based regional fee using information from providers who received state aid. Budget constraints resulted in the state funding the Medicaid rate at 75% of the calculated cost of services (fee).
The Comprehensive Outpatient Programs (COPs) Medicaid rate add-on was implemented in 1991 as a Medicaid enhancement project. Providers that received net deficit funding prior to the implementation of COPs saw that state funding converted to Medicaid funding and increased by 10%. This new system increased federal participation in the mental health programs. Nine criteria were established to ensure that COPs providers complied with these requirements (See Section II for more information). At a minimum, COPs providers receive the following Medicaid rate components:
Medicaid Base Rate + COPs add-on
For all services where the COPs rate applies the minimum, maximum, and average rate are in the chart below:
COPs Rate
| Min | Avg. | Max | |
|---|---|---|---|
| CDT | $0.20 | $25.69 | $106.36 |
| Clinic Treatment | $6.79 | $121.86 | $300.00 |
| Day Treatment | $1.58 | $42.74 | $194.66 |
| *Minimum rates do not factor in zeros | |||
| **Averages do not factor in zeros | |||
The COPs add-on amount increased several times between 1991 and 2003 for Cost of Living Adjustments (COLA), rate cap adjustments and additional conversions of state funds. The Medicaid base rate did not increase from 1991 to 2000. The following table details the changes in the COPs add-on that have occurred over time:
| Date | Description | Clinic | CDT | Day Treatment | COLA | Total |
|---|---|---|---|---|---|---|
| 4/91 | Initial conversion of Article 31 agencies | $52,831,463 | $9,783, 604 | $2,608,961 | $5,691,970 | $70,915,999 |
| 4/92 | Expand COPs to Article 28 agencies | $29,175,584 | $5,402,886 | $1,440,770 | $3,143,327 | $39,162,566 |
| 4/93 | Aggregate individual COPs rates into one combined rate | $20,501,762 | $3,796,623 | $1,012,433 | $2,208,824 | $27,519,641 |
| 4/95 | Increase of rate cap to $83.20 | $1,3247,292 | $2,453,202 | $654,187 | $743,320 | $17,098,002 |
| 4/98 | Allocation of the 2.5% COLA | $2,499,788 | $671,984 | $141,734 | $150,599 | $3,464,105 |
| 4/00 | Conversion of previously allocated non-COPs funds | $170,930 | $44,547 | $- | $6,464 | $221,941 |
| 5/00 | Increase of rate cap to $100 | $6355249 | $34,734 | $10,213 | $194,946 | $6,693,141 |
| 5/01 | Increase of rate cap to $200 | $23580026 | $317,539 | $383,854 | $747,534 | $25,665,350* |
| 4/03 | Conversion of Reinvestment funding to COPs | $9473969 | $613,902 | $715,793 | $- | $11,821,066* |
| 4/03 | Rate disaggregation and increase of rate cap to $300 | $118576 | $- | $- | $- | $118,576 |
| 4/03 | Conversion of Shared Staff to COPs | $7,812,148 | $647,893 | $457,971 | $- | $8,918,012 |
| Grand Total | $165,766,787 | $13,983,310 | $7,425,916 | $12,886,984 | $174,111,983 | |
* Totals include rate increases associated with PHP and IPRT services, which are outside the scope of this study. M/
Source: Fiscal Brief: Comprehensive Outpatient Programs (COPs), New York State Conference of Local Mental Hygiene Directors, Inc. October 2004. Retrieved December 7, 2006, from http://www.clmhd.org/resources/resources.aspx#604 ![]() .
.
In the following years, Non-COPs providers sought and received an add-on component. This add-on component is generally less than the COPs add-on. At a minimum, Non-COPs providers receive the following Medicaid rate components:
Medicaid Base Rate + Non-COPs add-on
For all services where the Non-COPs rate applies, the minimum, maximum, and average rate are in the table below:
Non-COPs Rate
| Min | Avg. | Max | |
|---|---|---|---|
| CDT | $1.37 | $4.66 | $7.73 |
| Clinic Treatment | $2.39 | $5.41 | $7.73 |
| Day Treatment | $1.94 | $4.45 | $5.80 |
| *Minimum rates do not factor in zeros | |||
| **Averages do not factor in zeros | |||
Over time Non-COPs providers have sought to equalize their total Medicaid rate with the rate received by the COPs providers. Both COPs and Non-COPs providers have sought Medicaid rate increases.
Focus of the Report
This report focuses on the reimbursements, costs and deficits associated with the current mental health Medicaid reimbursement methodology. The study considers the costs associated with three mental health services:
- Clinic
- Day Treatment
- Continuing Day Treatment (CDT)
The study aims to determine whether the current Medicaid reimbursement system is equitable and effective. Additionally, the study focused on recommending changes to the current system to ensure equitable reimbursements, an effective system and the provision of high quality service.
Study Methods
PCG employed a hybrid study approach, incorporating elements of a descriptive study with some elements of a case study. PCG used numerous data sources that provided both quantitative and qualitative data about the current reimbursement system. This hybrid method allowed for the use of diverse information streams and a comprehensive analysis of the current Medicaid reimbursement system.
For the descriptive portion of the study, NYS OMH provided quantitative data in several different forms:
- Consolidated Fiscal Reports (CFR)
- Medicaid Management Information System (MMIS) billing data
- Patient Characteristic File
- Institutional Cost Reports (ICR)
These data sources allowed us to compare costs and units of service across providers.
Although this study is not written as a case study, PCG conducted several interviews, focus groups and site visits to gather qualitative data. These data collection techniques are often used in case studies. For this study, PCG collected qualitative information from multiple sources, including:
- State level key informant interviews and meetings
- Two stakeholder meetings for providers and trade associations
- Meeting in Albany, NY on January 3 for stakeholders from Upstate New York.
- Meeting in Manhattan on January 5 for stakeholders from the New York City metropolitan area.
- Eight provider visits with key informant interviews
- Bleuler Psychotherapy Center, Inc., Forest Hills, Queens January 11
- F.E.G.S, New York City and Suburbs January 16
- Institute for Community Living, Inc., Brooklyn January 17
- Builders for the Family & Youth of the Diocese in Brooklyn, Far Rockaway January 17
- Metropolitan Center for Mental Health, Manhattan January 18
- St. Vincents Catholic Medical Centers, Harrison January 18
- Horizon Health Services, Buffalo January 19
- North Star Behavioral Health Services/Citizens Advocates, Malone January 19
The qualitative data collected at the meetings and site visits described above provided crucial information that could not be discerned from financial and billing data alone.
In addition to the quantitative data provided by the state and the qualitative data gathered by PCG, this report relies on several pre-existing sources of information about the Medicaid reimbursement methods currently employed by NYS OMH. These sources included:
- New York State regulations
- New York State Medicaid Plan
- Previously conducted reports and articles
PCG and NYS OMH also developed a provider survey as part of this project. However, following input from provider organizations, it was determined that the short time frame of the project was not sufficient to allow for accurate responses or a representative level of participation. As such the survey was not conducted.
Organization of the Report
This report is organized to provide the reader with all necessary information to understand the current Medicaid reimbursement system used for clinic, continuing day treatment and day treatment services. Data analysis and key findings follow the background information. The report concludes with PCGs finding and conclusions, as well as some reform principles that should be considered going forward.
Below is a brief description of each section of the report:
Section I provides a historical context for the report and an explanation of the study focus and methodology.
Section II provides a more in-depth look at the current reimbursement methodology, breaking the fee structure down piece by piece. Elements discussed in this section include:
- Article 31 (free standing provider) agencies and Article 28 ( general hospital provider) agencies, as defined in Section II;
- Regional variations;
- COPs and Non-COPs designations; and
- Medicaid Managed Care
Section II also provides a high level look at the mental health services included in this study and of the Comprehensive Outpatient Programs (COPs) designation. This section defines clinic, continuing day treatment and day treatment services and outlines the regulations that mandate services at COPs providers.
Section III provides detailed information about the qualitative and quantitative data used in this study including an overview of the stakeholder meetings, provider visits and an in-depth data analysis.
Section IV outlines the Findings and Conclusions that surfaced as a result of this study. This section also includes a discussion of the key considerations and the potential obstacles associated with alternate reimbursement methodologies.
II. NYS OMH Service Delivery Models and Reimbursement Rates
In this section we will provide the following:
- Overview of NYS OMH clinic, day treatment, continuing day treatment Medicaid base rate (fixed fee) methodology;
- Overview of COPs, Non-COPs, and CSP supplementary add-on methodology;
- Detailed description of clinic, day treatment, and continuing day treatment allowable services; and
- Detailed description of clinic, day treatment, and continuing day treatment Medicaid rates.
Reimbursement Methodology Overview
Two major components of clinic, day treatment and continuing day treatment program reimbursement are:
- Fairly uniform fixed fees (Medicaid base rate) for units of services and
- Highly variable, provider-specific supplementary payments.
Medicaid Base Rate Fixed Fees
New York State utilizes a fixed Medicaid base rate for reimbursing clinic, continuing day, and day treatment services. Fixed fees offer incentives to providers to deliver more units of a service, if the payment per unit of that service is greater than the providers marginal or incremental cost of delivering an additional unit of that service (e.g., the hourly salary and fringe benefits of the professional delivering it). If the payment per unit of service is less than the incremental costs of delivering it, providers have no financial incentive to deliver the service, therefore jeopardizing access in the short term. If the payment per unit is greater than the providers incremental costs, but still less than the providers total (incremental plus fixed) costs per unit of a service, access to and/or quality of the service may be sufficient in the short term but still be in jeopardy over the long term.
Fixed fees encourage cost-effective management practices, such as increasing clinician productivity ratios by adjusting hours of operations to the needs of the community, using contracted versus salaried staff if it is conducive to clinician productivity, adopting carefully researched approaches to reduce the no-show rate among clients, properly billing and pursuing recovery from difficult third party payers, etc. Many of these desirable practices are evident in New York State.
However, fixed fees do not encourage the expansion of services or other activities that would increase the providers costs without corresponding adjustments in fees. Fixed fees offer no assurance that providers will accept consumers without Medicaid or other insurance.
NYS OMHs fixed fees take into account many desirable treatment practices, such as optimum therapy session/visit duration, appropriate group therapy models, the involvement of family members and other collateral individuals in the care of the consumer, and reasonable limits on service volume. The fixed fees also take into account, to a degree, variations in regulatory requirements applicable to different types of providers; variations in the capital and labor markets associated with delivering care, such as the supply and demand for the skilled, dedicated professionals who deliver mental health services in communities throughout New York; and geographic variations within the State in costs, service availability, service volume, consumer mix, and other factors.
NYS OMHs fixed fees for clinic treatment are generally identical for children and adults, despite the substantial costs of child psychiatrists and clinical psychologists. New York does recognize a special program of day treatment for children that has its own reimbursement rules. Generally, fixed fees are identical for seriously and persistently mentally ill (SPMI) adults, non-SPMI adults, seriously emotionally disturbed (SED) children, and non-SED children.
Supplementary Payments
New York State utilizes supplementary add-ons to the Medicaid rate. The supplementary payments are determined using formulas that include the providers historical costs and net deficits as variables. There are large supplementary payments for Comprehensive Outpatient Programs (COPs) providers and smaller supplementary payments for Non-COPs providers and Community Support Program (CSP) services. Each component offers advantages and disadvantages that should be assessed individually, in combination and as they relate to the short- and long-term goals of the NYS OMH, the Governor and the State Legislature.
COPs and Non-COPs Providers
In return for the COPs reimbursement, COPs providers are required to adhere to the following regulations: 1
- Ensure access for individuals upon service availability; not on an individuals ability to pay.
- Provision of priority access to adults with serious mental illness or children with serious emotional disturbance.
- Provision of initial assessment to persons referred to inpatient or emergency setting within five business days.
- Agreement to engage with the LGU in annual planning activities.
- Assurance that services are provided to all individuals within a designate geographic area or target population for whom the COPs program is responsible as designated by the local governmental plan.
- Arrangement for the provision of 24-hour emergency services.
- Development of formal written agreements with inpatient services addressing access, case management, home care of other clinically necessary services.
- Creation of a consumer advisory board or inclusion of consumers on the governing body.
- Development of staffing patterns which take into account the cultural and ethnic background of consumers served.
Additionally, under Article 41 in 1984-85, one of the criteria for the initial COPs provider designation was that the provider received State funds.
Non-COPs providers also must adhere to certain regulations, including:
- Non-COPs providers must admit a client within 5 days of hospital discharge.
- Non-COPs providers will perform case management, when necessary.
- Non-COPs providers are not obligated to treat clients who are not insured or cannot pay the requisite fee.
Comprehensive Outpatient Program (COPs) supplementary payments are determined as follows:
- 2001 mental health grants are added to the deficit approved in the calculation of the COPs supplementary rate
- Mental health grant amounts are divided by the estimated annual number of Medicaid visits (average of the 3 most recent years/.909)
- An adjustment is made for Medicare/Medicaid crossover claims
- The supplement is subject to a cap of up to $300 per unit of service
The supplementary amount is applied to all outpatient claims, except for hospital-based providers where it is not applied to collateral, group collateral or home visits.
Since 2000, Non-COPs have received an add-on of 12.5%. This supplement is for a specific amount of units per service per year as determined by the Commissioner. Non-COPs providers must reimburse the state for any supplemental dollars received in excess of the threshold. COPs providers represent 80% of the clinic programs, 82% of the units rendered, and 90% of the Medicaid revenues.
Managed Care and Supplements
An increasing number of Medicaid recipients are enrolled in managed care organizations that receive Medicaid capitation payments for mental health services. Providers must seek Medicaid reimbursement through the Managed Care Organization (MCO) for these clients based on the requirements and payment methods of the MCO. Individual providers must negotiate the Medicaid managed care rate with the managed care organization. Reimbursement rates from MCOs are significantly lower than base rates used by states. For COPs providers, the state pays the COPs add-on amount separately (in addition) to the provider for outpatient services provided to a Medicaid managed care consumer.
Article 31/Article 28 Differences
Individual provider rates are further impacted by whether the provider is designated as an Article 28 or Article 31 provider. Article 28 providers are general hospital providers, defined in Article 28 of the Public Health Law, which are permitted to conduct an outpatient program for adults diagnosed with a mental illness and children diagnosed with emotional aberration in accordance with Part 587. Article 31 providers are free standing outpatient programs, pursuant to Article 31 of the Mental Hygiene Law, which are permitted to serve adults diagnosed with mental illness and children diagnosed with emotional aberration in accordance with Part 587. Article 31 providers have received annual cost of living adjustments on their fixed fees. Article 28 hospital based providers have lower fees because they have not received these COLAs but receive a cost-based rate which is still capped at $67.50, plus a capital pass-through. Since the cap has not been raised in almost 20 years, they now average less than freestanding providers. Article 28 Diagnostic and Treatment Centers (D&TC) receive the 1992 base rate, trended through 1995 and capped at the 1995 rate. Article 31 providers represent 82% of all clinic providers and 81% of Medicaid revenues.
CSP supplementarypayments
Community Support Payments (CSP) fund community based mental health programs that serve the severely and persistently mentally ill (SPMI) population. CSP rates are calculated based on:
- 1997-98 mental health aid grants
- Adjustments to grants based on percentage of services eligible for Medicaid reimbursement
- Adjustments to grants based on percentage of clients eligible for Medicaid
- Aggregation of all service units for clinic, continuing day treatment, and day treatment programs for children
- Computation of the average number of service units for the 3 years prior to the base year
- Division of the adjusted grant amount by the average number of service units
- Adjusted grant amount per unit is divided by 0.89
CSP rates vary based on provider. The table below illustrates the range in rate add-ons paid.
CSP Rate
| Min | Avg. | Max | |
|---|---|---|---|
| CDT | $11.10 | $53.38 | $170.73 |
| Clinic Treatment | $0.62 | $42.45 | $300.00 |
| Day Treatment | $4.24 | $25.70 | $117.47 |
| *Minimum rates do not factor in zeros | |||
| **Averages do not factor in zeros | |||
Clinic, Day Treatment, and Continuing Day Treatment Services
New York regulations state:
The purpose of outpatient programs for adults with a diagnosis of mental illness is the diagnosis and treatment of mental illness on an ambulatory basis. The goals of outpatient treatment for adults are to reduce symptoms, to maximize potential for recovery of meaningful social involvement to maintain the recipients capacity to function in the community, or when appropriate, to improve parental functioning while maintaining or restoring minor children to the care of the parent where feasible.2
NYS OMH providers are all tasked with the above policy. Provider types have similar goals, and some common aspects of service. During admission, all provider types are required to collect the same client information, including:
- Reason for referral;
- Primary clinical and service-related needs; and
- Admission diagnosis.
Also, clinics, day treatment for children, and continuing day treatment providers all offer the following services:
- Medication therapy;
- Medication education; and
- Symptom management.
Clinic Treatment
Clinic treatment consists of outpatient services for children and adults. These services are rendered face to face. The mission of clinics is to reduce symptoms, improve functioning and provide ongoing support. Upon intake, clinic clients are assessed to help identify mental health strengths and weaknesses. These assessments help drive treatment options.
Reimbursable services in a clinic setting: The following services are allowable for Medicaid Reimbursement:
Clinic Treatment Service Coverage
| For Adults | For Children | |
|---|---|---|
| Case management services |  |
|
| Clinical support services | |
|
| Crisis intervention services | |
|
| Family treatment services | |
|
| Health screening and referral | |
|
| Medication education | |
|
| Medication therapy | |
|
| Psychiatric rehabilitation readiness determination and referral | |
|
| Symptom management | |
|
| Verbal therapy | |
|
All of the services listed in the chart except case management, crisis intervention, clinic support services, and family treatment services are mandated by NYS OMH for all clinics. Medicaid fees also apply to psychiatric rehabilitation readiness determination and referral services that are mandated by NYS OMH for clinics serving adults.
Clinic Reimbursement Methodology
The New York Medicaid program reimburses NYS OMH-approved mental health clinic treatment programs using fixed fees plus supplementary payments.
Units of services: Medicaid fees for clinics are set based on units of service and require face to face encounters with consumers. Medicaid usually reimburses units of services equally, whether they are health screening, case management, or any of the other NYS OMH-approved clinic service. Medicaid fees generally are identical for children and adults. NYS OMH has defined units of service in terms of duration and type of a face-to-face encounter, as follows:
- Brief visit: 15-29 minutes
- Regular visit: 30 or more minutes
- Crisis visit: 30 or more minutes
- Group therapy visit: 60 or more minutes, in groups consisting of 2 12 consumers
- Collateral visit: 30 or more minutes with someone other than the consumer, such as a family member, for a purpose directly related to the care of the consumer
- Group collateral visit: 60 or more minutes, in groups consisting of 2 12 consumers
Brief visits qualify for fees that are half of the fees for regular, crisis, and collateral visits. Group and group collateral visits of 60 or more minutes qualify for fees that are, per individual, about 35% of the fees for encounters of 30 or more minutes with one individual. Thus, an hour-long group visit with four to 12 consumers usually would generate more reimbursement than two regular visits of 30 minutes each.
Geographic variations: Fees for clinics vary based on where the clinic is located. Clinics located in metropolitan New York City (New York City, Long Island, Westchester, Putnam, and Rockland Counties) qualify for the highest fees. Clinics located in Central and Western New York State qualify for 90% of the highest fees. Clinics in the Hudson River Valley, as well as clinics that received no State aid for mental health services in 1984-85, qualify for 88.33% of the highest fees.
Clinic Treatment Programs
| Brief visit | at least 15 minutes no more than 29 minutes face-to-face one-on-one between recipient and therapist |
|---|---|
| Regular visit | at least 30 minutes face-to-face one-on-one between recipient and therapist |
| Crisis visit | at least 30 minutes face-to-face one-on-one between recipient and therapist |
| Group therapy | at least 60 minutes provided to and from 2 to 12 recipients per therapist(s) |
| Family visit | at least 60 minutes face-to-face one recipient, one or more of his or her family members, and therapist |
| Collateral visit | |
| a. Clinical support services | at least 30 minutes face-to-face between one or more collaterals and one therapist with or without a recipient |
| b. Family treatment | at least 30 minutes face-to-face among all the following: a recipient, one or more family members, and a therapist |
| Group collateral visit | |
| a. Clinical support services | at least 60 minutes no more than 120 minutes face-to-face services to more than one recipient and/or his or her collaterals. Such visit need not include recipent but shall not include >12 collaterals and/or recipients with a therapist |
| b. Family treatment | at least 60 minutes no more than 120 minutes face-to-face shall include services to more than one recipient. For each recipient participant, at least one family member shall participate. However, only one group collateral bill per recipient is allowed per day. Shall not include >12 participants, including recipents and family members |
Visits are defined as a face-to-face interaction between a recipient or collateral and clinical staff for the provision of service. A visit shall involve one or more required or additional services or any optional services approved by the Office of Mental Health.
Clinic Treatment Programs
| Fee Schedule | ||||
|---|---|---|---|---|
| For Programs that Received State Aid 1984/1985 ( COPs) | Programs that Did Not Receive State Aid 1984/1985* (Non-COPs) | |||
| A 3 | B 4 | C 5 | ||
| Brief visit | $35.97 | $32.37 | $31.77 | $31.77 |
| Regular visit | $71.94 | $64.75 | $63.55 | $63.55 |
| Crisis visit | $71.94 | $64.75 | $63.55 | $63.55 |
| Group therapy | $25.18 | $22.66 | $22.25 | $22.25 |
| Family visit | Qualified family visits shall bill one regular visit and one collateral visit. | |||
| Collateral visit | $71.94 | $64.75 | $63.55 | $63.55 |
| a. Clinical support services | ||||
| b. Family treatment | ||||
| Group collateral visit | $25.18 | $22.66 | $22.25 | $22.25 |
| a. Clinical support services | ||||
| b. Family treatment | ||||
The Fee Schedule reflects the 2005/2006 Enacted State Budget
*Effective this year the Non-COPs providers will get the same base rate as the COPs providers
Day Treatment Programs Serving Children
Day treatment programs serve only children. These programs are designed to help juveniles with mental health illness acclimate to or re-enter educational settings. Day treatment is designed to provide a continuity of care once the client has been discharged from an inpatient setting. Services include social, vocational, and educational activities to maintain or enhance the functioning level of the child.
Payment amounts for day treatment providers vary based on the length and type of visit and whether the provider is located in New York City (the five boroughs). Providers that received no mental health state aid in 1984-85 receive the lower reimbursement amount regardless of their geographic location.
Day treatment services are used less frequently than clinic and continuing day treatment programs, based on the number of units reported in a year. Day Treatment services are provided face to face to clients.
Reimbursable services in day treatment programs for children: Medicaid reimburses for the following services:
Day Treatment Program Coverage
| Case management | |
| Crisis intervention services | |
| Health referral | |
| Medication therapy | |
| Social training | |
| Socialization | |
| Task and skills training | |
| Verbal therapy | |
Medicaid generally reimburses these services equally. All of these services are mandated by NYS OMH for all day treatment programs for children.
Day Treatment Programs Reimbursement Methodology
The New York Medicaid program reimburses NYS OMH-approved day treatment programs for children based on allowable numbers of hours of day treatment services, plus supplementary payments. The hourly payment amounts vary based on the geographic region of the State and the hours of services provided in a day. Day treatment programs qualify for supplementary payments in the same way as clinics and CDTs.
Units of services: Medicaid fees for day treatment programs for children are for visits and full or partial days. Medicaid usually reimburses units of services equally, whether they are health referral, medication therapy, or any other NYS OMH-approved day treatment program service. NYS OMH has defined units of service in terms of duration and type of visit, as follows:
- Full day: 5 or more hours
- Half day: 3-5 hours
- Brief day: 1-3 hours
- Collateral visit: 30 minutes or more
- Home visit: 30 minutes or more
- Crisis visit: 30 minutes or more
- Preadmission visit, full day: 5 or more hours
- Preadmission visit, half day: 3-5 hours
Half day visits are generally reimbursed at half the amount of full day visits and brief day visits at one-third the amount of full day visits. Collateral visits generally are reimbursed at the same amount as brief visits.
Day Treatment Programs Serving Children
| Fee Schedule | ||||
| For Programs that Received State Aid 1984/1985 | For Programs that Did Not Receive State Aid 1984/1985 | |||
|---|---|---|---|---|
| A6 | B7 | |||
| Full day visit | at least 5 hours | $70.01 | $67.68 | $67.68 |
| Half day visit | at least 3 hours no more than 5 hours | $35.01 | $33.84 | $33.84 |
| Brief day visit | at least 1 hour no more than 3 hours | $23.34 | $22.52 | $22.52 |
| Collateral visit | at least 30 minutes | $23.34 | $22.52 | $22.52 |
| Home visit | at least 30 minutes | $70.01 | $67.68 | $67.68 |
| Crisis visit | at least 30 minutes | $70.01 | $67.68 | $67.68 |
| Pre-admission visit-full day | at least 5 hours | $70.01 | $67.68 | $67.68 |
| Pre-admission visit-half day | at least 3 hours no more than 5 hours | $35.01 | $33.84 | $33.84 |
Geographic variations: Day treatment programs for children located in New York City that received State aid for mental health services in 1984-85 qualify for fees that are about 3.5% higher than other programs.
Continuing Day Treatment
Continuing day treatment (CDT) programs serve adults, typically those with a long-standing mental illness. Many CDT clients have been hospitalized in a psychiatric setting but have been discharged and transitioned to live in the community. The goal of CDT is to help clients develop the skills necessary for independent living while maintaining a continuity of care. CDT services are provided face to face to clients.
Reimbursable services in a CDT setting: The following activities are included in continuing day treatment services:
Continuing Day Treatment Coverage
| Activity therapy | |
| Case management | |
| Clinical support services | |
| Crisis intervention services | |
| Health referral | |
| Medication education | |
| Medication therapy | |
| Psychiatric rehabilitation readiness determination and referral | |
| Rehabilitation readiness development | |
| Supportive skills training | |
| Symptom management | |
Seven of these services are mandated by NYS OMH for all CDTs.
Continuing Day Treatment Programs
| Continuing day | RAMS at least 1 hour no more than 5 hours per recipient per day |
| a. Regular visit | |
| b. Crisis visit | |
| Collateral visit | at least 30 minutes no more than 120 minutes face-to-face interaction between one or more collaterals and one therapist with or without a recipient. |
| Group collateral visit | least 60 minutes no more than 120 minutes shall represent service to more than one patient and/or his or her collaterals. Such visits need not include patients but shall not include >12 collaterals and/or recipients in a face-to-face interaction with a therapist. |
Continuing Day Treatment Reimbursement Methodology
The New York Medicaid program reimburses NYS OMH approved continuing day treatment (CDT) programs based on allowable numbers of hours of CDT services, plus supplementary payments. The hourly payment amounts vary based on the geographic region of the State and the hours of CDT services per month per client. CDTs qualify for supplementary payments in the same way as clinics.
Units of services: Medicaid reimburses CDT programs for visits and allowable numbers of hours. CDT regular visits are usually between 1 and 5 hours, collateral visits are 30 minutes to 2 hours, and group collateral visits are 1 to 2 hours. Medicaid usually reimburses hours equally, whether they are health screening, case management, or any of the other NYS OMH-approved CDT services, and whether they are for regular, collateral, or group collateral visits. But payments per hour are about 26% lower for CDT programs that provide 80 or more hours of services per month per client than CDT programs that provide 51 to 80 hours per month per client.
Continuing Day Fee Schedule
| A8 | B9 | C10 | Non-COPs | |
|---|---|---|---|---|
| Service hour 1-50 | $13.20 | $11.88 | $11.88 | $11.88 |
| Service hour 51-80 | $10.45 | $10.45 | $10.45 | $10.45 |
| Service hour beyond 80 | $7.70 | $7.70 | $7.70 | $7.70 |
Geographic variations: Payments are about 26% higher for CDT programs in metropolitan New York City that received State aid for mental health services in 1984-85 and provide 1 to 50 hours per month per client of services, as compared with CDT programs in the same area that provide 51 to 80 hours per month per client. The payments are 11.5% higher under the same circumstances outside metropolitan New York City.
Although there are several similarities between the three provider types, the current Medicaid reimbursement system is built on the differences among the providers. These differences come in the form of a COPs or Non-COPs designation and the services offered by each provider.
III. Analysis of NYS OMH Data
Qualitative Data Analysis
PCG facilitated two stakeholder meetings and conducted eight provider visits in order to obtain qualitative data for this study. The qualitative data was not meant to be all-encompassing; instead it provided much-needed context through which we could examine the quantitative data.
Because PCG only visited 8 providers in a system of 455 statewide the information we collected from these visits cannot necessarily be generalized to the entire provider community. Similarly, information from the COPs and Non-COPs providers we visited cannot be relied upon to be representative of all COPs or Non-COPs providers in their region or of their size. As a result, PCG has chosen not to include detailed information gathered at the provider visits and stakeholder meetings: We do not want to present the experiences of a few providers as those of the system as a whole.
Instead, this section provides a high-level overview of themes that emerged from our qualitative research. The themes are broken down into three categories:
- General Themes: These are the issues, thoughts, statements and concerns that cut across provider type and agency location.
- COPs Themes: These subjects were repeated by several COPs providers.
- Non-COPs Themes: These subjects were repeated by several Non-COPs providers
General Themes
- Providers do not believe there are significant differences in the services provided by COPs and Non-COPs providers. This sentiment was repeated by COPs and Non-COPs providers alike.
- The client population and range of services provided have changed dramatically since the early 1990s. Mental health referrals are increasing as hospitals and correction facilities discharge clients to mental health providers.
- The severity of the mental health issues being addressed at clinics has increased over the past 15 years.
- The staffing structure i.e. unionized vs. non-unionized, salaried vs. fee-for service is the biggest cost differential between providers.
- In the clinic setting, serving children is more costly than serving adults.
- Most providers are committed to quality assurance measures, although there is a wide variety from one provider to the next in the scope of quality measures used.
- No-shows are problem for all providers, and while many providers are taking steps to lower their no-show rates, there is no magic bullet that will eliminate this issue.
- The rates paid by most Medicaid Manage Care Organizations are too low to support the services provided.
- Staff recruitment and turnover is a universal problem, although the specific recruitment issues that providers have vary from place to place.
- Medicaid rates only pay for direct service, but there is a significant amount of administrative and other work that must occur outside of the visit in order to provide the consumer with a high level of care. This work is not accounted for in the Medicaid rate.
- A providers location impacts many factors: cost, consumer population, the need for bilingual services.
COPs Themes
- COPs providers uniformly stated that losing the COPs add-on would significantly reduce the number of services they offer.
- COPs providers believe their costs are higher because they are seeing more SPMI consumers than Non-COPs providers.
- Costs associated with administering the COPs program add to the overall cost of services at COPs agencies.
- The COPs ceiling on the amount of add-on reimbursement a provider can receive in a year is problematic because it does not allow for caseload growth and because it causes some unpredictability in revenue.
Non-COPs Themes
- Although Non-COPs providers may not be required to meet some of the COPs requirements, many indicated that they do.
- Non-COPs providers do not believe there is a substantial difference in the number of SPMI consumers served by them than by COPs providers.
- Because Non-COPs providers do not have a financial safety net, they say they have adopted many cost-cutting measures, like having administrators fill two or more functions.
- Non-COPs providers fear that if a new reimbursement system is developed by NYS OMH that is closed to their participation, it will once again leave them behind by recreating a rate structure that they believe is inequitable.
PCG used a variety of data sources, described below, provided by NYS OMH to identify trends in cost and revenue based on a variety of factors, such as type of provider, location of provider, services offered, and consumer characteristics. This data is intended to illustrate, confirm and quantify the themes that were presented in stakeholder meetings and provider visits. We have identified some major themes and trends in the data below that indicate significant disparities in cost, revenue, gains and losses among providers. The main themes presented in this section include:
- Clinic programs shows considerable aggregate losses of $54.5 million, while Day Treatment shows a small deficit of $2.0 million and CDT programs show gains of $5.9 million.
- Eighty nine (89%) of the deficits incurred in the clinic are attributable to 10% of the provider population. However, it is not clear if this phenomenon is due to data quality problems, actual provider performance or a combination of both.
- The ninety percent of the provider population represents 309 programs and accounts for $11.0 million in deficits.
- COPs providers generate almost twice as much revenue per unit as non-COPs providers but COPs providers expenditures are twice as high leading to slightly greater losses and higher costs than Non-COPs providers.
- COPs providers in the clinic program represent 80% of the providers, render 80% of the services but generate 90% of the Medicaid revenues due to the COPs supplemental payments. Although this is the case, the COPs providers have the highest deficits.
- Variances in revenue and costs are significant between COPs and Non-COPs when comparing clinic programs, but are not as significant in Day Treatment or CDT Programs, which do not utilize an add-on reimbursement rate.
- Net gains and losses are heavily influenced by where a provider is located.
- Variations between providers costs and revenue indicate huge differences in how providers are controlling costs and billing revenue sources.
- The effects of size and location on provider costs and revenue vary and do not follow a consistent pattern.
Quantitative Data Analysis
Data Sources
NYS OMH has provided PCG with numerous data sources to help us capture the current landscape of Medicaid reimbursements. Some of the data received and reviewed by PCG are:
- Consolidated Fiscal Reports
- Medicaid Management Information System claims data
- Institutional Cost Reports
- Patient Characteristics Data
Each of these data sets is described more fully below.
Consolidated Fiscal Report (CFR) Data
The Consolidated Fiscal Report is a standardized accounting methodology and reporting tool. These annual reports collect financial and statistical data for providers that participate in the Medicaid program. The data represents both Article 28 (hospital based clinics) and Article 31 (free standing based clinics) providers that submitted a CFR for 2005. For this study, PCG analyzed calendar year 2005 CFR data for clinic, continuing day treatment and day treatment programs to identify revenue sources and service costs by cost categories. In 2005, there were approximately 455 New York agencies/programs that received Medicaid revenue for mental health services. Out of the 455 agencies/programs, we analyzed 346 programs from across New York State.11 Below is an overview of the 346 agencies and programs included in the study. Clinic treatment programs represent 62% of the providers included in this study.
Comparison of Types of Programs offered by Providers
| Region | Total Number of Programs | Number of Clinic Treatment Programs | % of Total Programs | Number of CDT Programs | % of Total Programs | Number of Day Treatment Programs | % of Total Programs |
|---|---|---|---|---|---|---|---|
| New York City | 132 | 88 | 66.7% | 33 | 25.0% | 11 | 8.3% |
| Suburbs | 56 | 33 | 58.9% | 18 | 32.1% | 5 | 8.9% |
| All Other | 158 | 94 | 59.5% | 50 | 31.6% | 14 | 8.9% |
| Total | 346 | 215 | 62.1% | 101 | 29.2% | 30 | 8.7% |
Agencies are required to report CFR data under the following categories:
- Revenue: Represents all revenue including third party revenue, grants and state and local net deficit funding.
- Personal Services: Represents cost of agency personal services related to program including support, direct care, clinical and program administration and LGU administration for programs.
- Fringe Benefits: Represents fringe benefits corresponding to personal services including FICA, retirement benefits, group life insurance, etc.
- Other Than Personal Services: Includes professional fees (i.e., accounting, payroll, legal, consulting, etc.), employment recruiting (i.e., advertising, employee referral fees, temporary office help, etc), supplies (i.e., general supplies, postage and shipping, cleaning, etc.), travel (i.e., airfare, training, vehicles, and conferences for program staff) and other categories that may be applicable.
- Property and Equipment: Represents cost incurred on all physical plant equipment (i.e., depreciation, interest, lease expenses, etc.) and property maintenance (i.e., repairs, insurance, taxes, utilities, depreciation building improvement, etc.).
- Administration: Represents expenses that are not directly associated to a particular program but rather to the broad management of programs, or maintenance for the agency, such as personnel that is not directly related to any particular program, service or contract.
Medicaid Management Information System (MMIS) Claim Data
The Office of Mental Health provided Medicaid Management Information System data to PCG with claims data by provider. The MMIS data include information such as service provider, county location, types of services, and specific services provided. They also include 2005 information about number of visits per service, base rate, COPs rate, Non-COPs rate, CSP rates and total rates charged per specific services. The data represent all claims paid by Medicaid for clinic treatment, continuing day treatment and day treatment programs.
Medicaid Payments by Type of Service
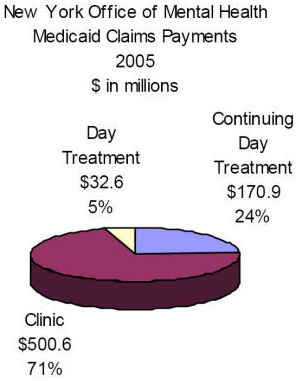
As shown in the graph, a review of the claim data shows that NYS OMH paid:
- $500.6 million (71%) for clinic treatment programs,
- $171.0 million (24%) for CDT programs and
- $32.6 million (5%) for day treatment programs.
These figures included Medicaid base rates, and COPs, Non-COPs and CSP add-ons.
Agencies/Programs by Type of Service
New York State Office of Mental Health
Number of Agencies/Programs That Received Payments from Medicaid 2005
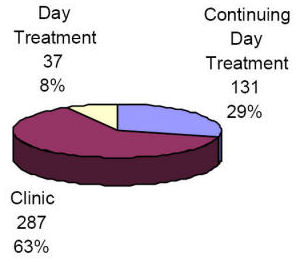
As shown in the chart, there were a total of 455 agencies/ programs in 2005 who received Medicaid payments for mental health services. Of 455 programs, 63% were clinic programs, 29% were CDT programs and 8% were Day Treatment programs. The Medicaid data from all 455 programs confirms that clinics represent a similar percentage of programs as is presented in the CFR data for the 346 providers included in this study.
Institutional Cost Report
Institutional Cost Reporting (ICR) is used to report the total revenue and expenses to the Office of Mental Health by hospitals. ICR uses the most recent allocation percentages from the step down originated from the last Institutional Cost Report. At the time of this study, the most recent ICR is from 2002. The ICR data was not used for this study because the data represented 2002 costs and could not be accurately compared to other data sources from 2005.
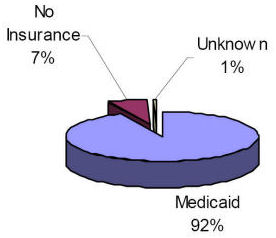
Patient Characteristic Data
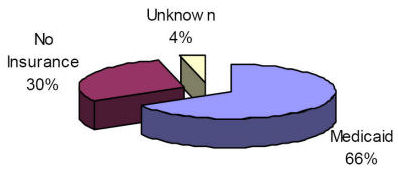
The Patient Characteristic data represents a snapshot of the number of consumers, type of insurance, age and diagnoses for consumers seen at mental health clinics during one week in a year. NYS OMH requires all providers to document an extensive list of characteristic for all consumers that receive services at the clinic for one week each year. The data used for this study was for the third week of October 2005, which was the most currently available. The Patient Characteristics data allowed PCG to better understand who mental health providers are serving. The data includes the consumers provider county, age and types of insurance.As shown below, the percentage of consumers with Medicaid was 65% for clinic treatment, 66% for day treatment and 92% for continuing day treatment. The patient characteristics file reviewed by PCG did not include insurance other than Medicaid or No Insurance. The designation of unknown in the graphs below represents clients that have insurance other than Medicaid.
New York State Office of Mental Health
Characteristic of Patient Population
Clinic Treatment

New York State Office of Mental Health
Characteristic of Patient Population
Continuing Day Treatment
New York State Office of Mental Health
Characteristic of Patient Population
Day Treatment
The patient characteristic file is also used to compile the consumer illness severity. The following chart shows that overall that 57% of the consumer population has a severe, persistent mental illness (SPMI - Adults) or serious emotional disturbance (SED - children).
| Program | ||||
|---|---|---|---|---|
| Illness Severity | Clinic | CDT | DT | Total |
| Non-SPMI / SED | 48% | 4% | 5% | 41% |
| SPMI / SED | 50% | 95% | 94% | 57% |
| Unknown | 2% | 1% | 1% | 2% |
| Total | 100% | 100% | 100% | 100% |
Data Analysis
The intent of this section is to highlight differences in provider revenues and provider costs across similar and dissimilar provider types. There are material differences in revenues and expenses per unit across similar and dissimilar provider types. There is a strong correlation between how much the provider generates in revenue and how much that provider spends. In many cases, the more revenue the provider generates, the more costs the provider will incur. The opposite is also represented: the less the provider generates in revenue, the less that provider will incur in expenses. The analysis of per unit results shown later in this section of the report will highlight the correlation between revenues and expenses. The analysis will also demonstrate the wide variations between providers in cost and revenue.
The charts below represent total gains and losses incurred by providers for clinic treatment, continuing day treatment, and day treatment services. The chart demonstrates that current losses of $54.5 million for clinic treatment programs differ drastically from the $2.0 million loss in the Day Treatment program and the $5.9 million gain realized by CDT program.
Net Gains and Losses for All Mental Health Providers
All programs
Net Gain/(Loss) in $ millions
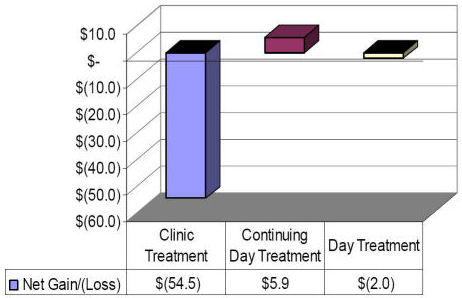
The differences in net gains and losses by program indicates a disparity in reimbursement strategies and cost containment by program. However, when taking a closer look at the net income and loss data, there are a number of providers that have significant deficits that are contributing to the high net deficit number, particularly in clinic treatment. These providers or net deficit outliers have the potential to skew the results which could lead to inaccurate assumptions concerning revenue, cost and net income. It is not known whether these outliers are due to data reporting problems or whether the providers actually incurred these gains or deficits. Therefore, it was decided to remove these outliers from all detailed financial analysis, particularly when analyzing per unit results. However, it is important to note the impact these outliers have on the overall results so that any decision or recommendations under consideration take into account these outliers.
The outliers for clinic and day treatment programs were determined by taking the top 5% and bottom 5% of all providers by program based on net gain. For day treatment, there are 30 programs in the study and two of the providers or 10% of the population was identified as having large net deficit amounts. The disparity between providers with net gains for day treatment were minimal and no providers were identified as net gain outliers.
The first table below shows the number of programs in each category and the second table displays the breakdown of net gain/(loss) in millions. A review of the clinic treatment results show that $48.6 million or 89% of the net loss outliers are attributable to 13 out of 215 programs while the net gain outliers of $12.8 million represent 11 programs. Overall 90% of the providers (191 programs) incurred a combined net deficit of $18.7 million or 35% of the total deficit.
| Number of Programs | |||
|---|---|---|---|
| Clinic Treatment | Continuing Day Treatment | Day Treatment | |
| Net Gain Outliers | 11 | 5 | 0 |
| 90% of Providers | 191 | 90 | 28 |
| Net Deficit Outliers | 13 | 6 | 2 |
| Total | 215 | 101 | 30 |
| Net Gain/(Loss) in $ millions | |||
|---|---|---|---|
| Clinic Treatment | Continuing Day Treatment | Day Treatment | |
| Net Gain Outliers | $12.8 | $4.7 | $0.0 |
| 90% of Providers | -$18.7 | $7.5 | -$0.2 |
| Net Deficit Outliers | -$48.6 | -$6.4 | -$1.8 |
| Total | -$54.5 | $5.9 | -$2.0 |
This table shows the number of units by program for each of the three categories by program.
| Number of Units | |||
|---|---|---|---|
| Clinic Treatment | Continuing Day Treatment | Day Treatment | |
| Net Gain Outliers | 399,360 | 90,720 | 0 |
| 90% of Providers | 3,456,185 | 6,057,257 | 376,356 |
| Net Deficit Outliers | 360,350 | 207,496 | 15,772 |
| Total | 4,215,895 | 6,355,473 | 392,128 |
The disparity in numbers looks more dramatic when viewing the results from a per unit perspective. The table below shows the difference in net gain/(loss) per unit for each category. As displayed, the difference in results for each of the categories is substantial. The providers in the 90% category for clinic and day treatment programs have drastically lower per unit deficits compared to the total deficits while the continuing day treatment gain is slightly better than the total for the program. In all cases the net deficit outliers increase per unit loss per program.
| Net Gain/(Loss) Per Unit | |||
|---|---|---|---|
| Clinic Treatment | Continuing Day Treatment | Day Treatment | |
| Net Gain Outliers | $32.17 | $52.10 | |
| 90% of Providers | -$5.42 | $1.24 | -$0.46 |
| Net Deficit Outliers | -$134.98 | -$30.70 | -$115.41 |
| Total | -$12.94 | $0.92 | -$5.08 |
The majority of the outliers reside heavily with COPs providers compared to non-COPs providers. As displayed in the table below, non-COPs providers only had a total of 2 net gain outliers and 3 net loss outliers.
Non-COPs providers
| Number of Programs | |||
|---|---|---|---|
| Clinic Treatment | Continuing Day Treatment | Day Treatment | |
| Net Gain Outliers | 1 | 1 | 0 |
| 90% of Providers | 40 | 27 | 8 |
| Net Deficit Outliers | 1 | 2 | 0 |
| Total | 42 | 30 | 8 |
As shown in the table below, COPs providers had 32 out of total the 37 outliers.
| Number of Programs | |||
|---|---|---|---|
| Clinic Treatment | Continuing Day Treatment | Day Treatment | |
| Net Gain Outliers | 10 | 4 | 0 |
| 90% of Providers | 151 | 63 | 20 |
| Net Deficit Outliers | 12 | 4 | 2 |
| Total | 173 | 71 | 22 |
For the purposes of this report, we removed the outliers from the study. The reason to remove provider outliers from the study was made so that per unit analysis would not be skewed by outliers with high net gains or deficits. The largest net gain of $2.3 million in the CDT program was not removed because it was the largest provider of services representing over 10% of the units and its per unit results were in line with program averages. However, the second largest provider gain of $1.4 million was removed from the study since it had cost of $485 per unit.
There were no large net gains removed from the study since the results were consistent with other Day Treatment providers and the per unit results were in line with other providers.
| With Provider Outliers | Removal of Provider Outliers | |||
|---|---|---|---|---|
| Program | Deficit | Gain | Deficit | Gain |
| Continuing Day Treatment (1) | -$2,205,952 | $2,327,086 | -$644,331 | $2,327,086 |
| Clinic Treatment | -$13,538,663 | $2,233,220 | -$1,489,324 | $470,218 |
| Day Treatment (2) | -$1,677,435 | $379,705 | -$657,485 | $379,705 |
Analysis of provider results for 90% of the provider population
The remainder of the data analysis in this section of the report will focus on the 90% of the provider population included in this study.
When COPs providers gains and deficits are compared to Non-COPs providers as in the chart below, COPs providers show an aggregate loss compared to Non-COPs providers. The contributing factors to these variances are discussed in greater detail in Section IV of this report.
Net Gains and Losses: COPs vs. Non-COPs
All Programs
Net Gains (Loss) in $ millions
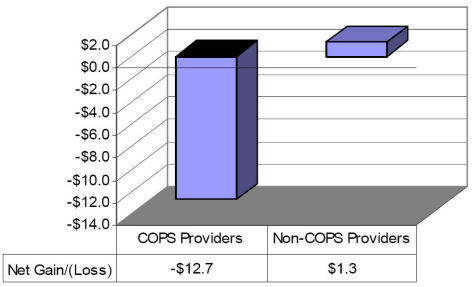
Shown in the chart is the distribution of net results by program. Clinic treatment programs experienced the greatest deficits followed by a slight deficit for day treatment. Continuing day treatment showed the most favorable results for COPs and Non-COPs providers.
| $ in millions | |||||
|---|---|---|---|---|---|
| Provider Type | Clinic | CDT | DT | Total | |
| COPs Providers | ($15.1) | $2.5 | ($0.1) | ($12.7) | |
| Non-COPs Providers | ($3.6) | $5.0 | ($0.0) | $1.3 | |
| Total | ($18.7) | $7.5 | ($0.2) | ($11.4) | |
When provider gains and losses for clinic treatment services are compared to the number of units served, and amount of Medicaid revenue, providers with the largest deficits have the largest number of units and receive the most Medicaid revenue. A larger percentage of revenue does not translate into a lessened likelihood of showing losses; in fact, the opposite is true: the more Medicaid revenue, the greater the loss. COPs providers render 80% of the services, incur 80% of the deficits yet generate 90% of the Medicaid revenues.
There are several factors that impact provider results. Two of them in particular are highlighted in the following chart. One is the amount of uninsured or underinsured consumers who are served. The second is the level of SPMI consumers served. The higher number of uninsured served by a provider, it is more likely the provider will need some type of net deficit funding to support the uninsured population. We also heard anecdotally that it is more costly to serve the SPMI consumer population. The table shows that non-COPs providers serve 6% more consumers with Medicaid and 3% less consumers with SPMI. These differences between COPs and non-COPs are similar and would indicate that reimbursement rate variations factoring in these numbers would be minimal and not vary as widely as the differences in the existing rates.
Clinic Treatment Services
| County | Provider Type | Net Gain/ (Loss) in millions | Total % of Net Gain/ (Loss) | # of Units | Total % of Units | Medicaid Revenue in millions | Total % of Medicaid | Total % Medicaid Eligible | SPMI % |
|---|---|---|---|---|---|---|---|---|---|
| New York City | COPs | -$5.76 | 30.7% | 1,075,178 | 31.1% | $106.78 | 40.0% | 74.6% | 53.1% |
| NY Suburbs | COPs | -$4.66 | 24.9% | 433,879 | 12.6% | $35.90 | 13.4% | 53.2% | 49.7% |
| All Other | COPs | -$4.68 | 24.9% | 1,259,989 | 36.5% | $98.44 | 36.8% | 68.1% | 48.5% |
| COPs
Sub-total |
-$15.10 | 80.5% | 2,769,046 | 80.1% | $241.11 | 90.2% | 68.1% | 50.5% | |
| New York City | Non-COPs | -$2.16 | 11.5% | 568,584 | 16.5% | $21.80 | 8.2% | 73.1% | 49.4% |
| NY Suburbs | Non-COPs | -$0.04 | 0.2% | 6,850 | 0.2% | $0.20 | 0.1% | 71.8% | 30.9% |
| All Other | Non-COPs | -$1.45 | 7.7% | 111,705 | 3.2% | $4.14 | 1.5% | 63.3% | 39.5% |
| Non-COPs Sub-total | -$3.65 | 19.5% | 687,139 | 19.9% | $26.14 | 9.8% | 73.9% | 47.4% | |
| Total | -$18.75 | 100.0% | 3,456,185 | 100.0% | $267.25 | 100.0% | 69.0% | 50.0% |
Source:
Net Gain/(Loss) 2005 CFR data
Total % of Medicaid Eligible Patient Characteristic File
SPMI % of Medicaid Eligible Patient Characteristic File
Per Unit Analysis of Revenue and Expenses
The following section reports total revenue and expenses per unit by cost category. The intent is to show that variations in revenue and cost exist within the current system and any reimbursement methodology would have to account for legitimate variations in cost across providers for the system to be considered equitable for all providers.12
The analysis consists of the following:
- COPs vs. Non-COPs providers for clinic, continuing day treatment and day treatment
- Gains and Losses by Region for clinic Treatment, CDT, and day Treatment
- Gains and Losses by Program Size and Region for clinic treatment, CDT, and day treatment
1. COPs vs. Non-COPs Costs and Revenues for Clinic, CDT and Day Treatment Services
For clinic treatment providers, the associated revenue and costs were reported in the 2005 CFR as described above. This data is shown in the table below by cost and revenue per unit. The variance column intends to demonstrate the magnitude of variances between COPs and Non-Cops with regard to spending and revenue.
Costs are driven by a number of different sources, some within the providers control and some that are not. Cost drivers can include:
- Geographic Location
- Client needs and characteristics
- Staffing models, including the impact of unions
- Productivity and no-shows
- Provider size
- Non-reimbursable services
- Medicaid Managed Care
- Uninsured clients
These cost drivers are discussed in greater detail in Section IV below but must be taken into account when considering cost data.
COPs providers spend considerably more funds per unit than Non-COPs providers. COPs providers also generate more funds per unit than Non-COPs providers due to the COPs add-on supplemental payment by Medicaid.
Revenues are 94% higher for COPs providers compared to Non-COPs providers and spend 86% more than Non-COPs providers. The majority of the increase in COPs expenditures are mainly in personal services, which are 179% more than Non-COPs providers, and in fringe benefits which are 266% higher than Non-COPs amounts. COPs provider deficits are 4.2% of revenue while Non-COPs providers show net deficits at 7.9% of revenues.
Clinic Treatment
| Clinic Treatment | Per Unit Service | |||
|---|---|---|---|---|
| COPs | Non-COPs | Total Variance | Variance % | |
| Number of Programs | 151 | 40 | ||
| # of Units | 2,769,046 | 687,139 | ||
| Revenue | ||||
| All Revenue Sources | $ 129.51 | $ 66.86 | $ 62.65 | 93.7% |
| Cost Categories | ||||
| Personal Services | $ 71.33 | $ 25.60 | $ 45.73 | 178.6% |
| Fringe Benefits | $ 19.73 | $ 5.40 | $ 14.34 | 265.6% |
| Other Than Personal Services | $ 19.79 | $ 21.19 | $ (1.40) | -6.6% |
| Property and Equipment | $ 7.05 | $ 3.77 | $ 3.28 | 86.9% |
| Administration | $ 17.06 | $ 16.21 | $ 0.85 | 5.2% |
| Total Cost | $ 134.96 | $ 72.53 | $ 62.44 | 86.1% |
| Net Gain/(Loss) | $ (5.45) | $ (5.31) | $ (0.14) | 2.7% |
| Net Gain/(Loss) as a % of Total Revenue | -4.2% | -7.9% | 3.7% | -47.0% |
| Net Gain/(Loss) Absolute Value | -$15,098,082 | -$3,647,750 | $ (11,450,332) | 313.9% |
The following table demonstrates the variation between COPs and Non-COPs providers in CDT programs is not as significant when compared to clinic treatment programs. Both COPs and Non-COPs providers generate favorable gains. COPs providers generate almost $2 more per unit in revenue than Non-COPs providers but also spent $4 more per unit. COPs providers experienced a net gain of 3% of revenue, whereas, Non-COPs providers showed a 15% net gain of revenue. Non-COPs providers seem to be doing a better job a managing bottom line results and controlling costs.
Continuing Day Treatment
| Continuing Day Treatment | Per Unit Service | |||
|---|---|---|---|---|
| COPs | Non-COPs | Total Variance | Variance % | |
| Number of Programs | 63 | 27 | ||
| # of Units | 4,307,130 | 1,750,127 | ||
| Revenue | ||||
| All Revenue Sources | $ 21.03 | $ 19.25 | $ 1.78 | 9.3% |
| Cost Categories | ||||
| Personal Services | $ 9.56 | $ 7.93 | $ 1.63 | 20.5% |
| Fringe Benefits | $ 2.71 | $ 1.94 | $ 0.78 | 40.0% |
| Other Than Personal Services | $ 3.57 | $ 3.31 | $ 0.26 | 7.8% |
| Property and Equipment | $ 1.89 | $ 0.76 | $ 1.13 | 149.3% |
| Administration | $ 2.72 | $ 2.45 | $ 0.27 | 11.0% |
| Total Cost | $ 20.45 | $ 16.39 | $ 4.06 | 24.8% |
| Net Gain/(Loss) | $ 0.58 | $ 2.86 | $ (2.28) | -79.6% |
| Net Gain/(Loss) as a % of Total Revenue | 2.8% | 14.9% | -12.1% | -81.3% |
| Net Gain/(Loss) Absolute Value | $2,510,836 | $5,004,856 | $ (2,494,020) | -49.8% |
The following table demonstrates that revenues are 88% higher for COPs providers compared to Non-COPs providers and COPs providers spend 84% more than Non-COPs providers. The impacts of these results are not as material when compared to clinic treatment program since day treatment is a much smaller program and the programs are close to breakeven.
Day Treatment
| Day | Per Unit Service | |||
|---|---|---|---|---|
| COPs | Non-COPs | Total Variance | Variance % | |
| Number of Programs | 20 | 8 | ||
| # of Units | 304,226 | 72,130 | ||
| Revenue | ||||
| All Revenue Sources | $ 73.39 | $ 39.10 | $ 34.29 | 87.7% |
| Cost Categories | ||||
| Personal Services | $ 41.04 | $ 23.01 | $ 18.03 | 78.4% |
| Fringe Benefits | $ 11.06 | $ 6.35 | $ 4.71 | 74.3% |
| Other Than Personal Services | $ 10.41 | $ 4.68 | $ 5.74 | 122.6% |
| Property and Equipment | $ 3.87 | $ 2.43 | $ 1.45 | 59.6% |
| Administration | $ 7.47 | $ 3.70 | $ 3.77 | 101.9% |
| Total Cost | $ 73.86 | $ 40.16 | $ 33.70 | 83.9% |
| Net Gain/(Loss) | $ (0.46) | $ (0.42) | $ (0.04) | 9.6% |
| Net Gain/(Loss) as a % of Total Revenue | -0.6% | -1.1% | 0.5% | -41.6% |
| Net Gain/(Loss) Absolute Value | -$141,129 | -$30,539 | $ (110,590) | 362.1% |
2. Gains and Losses by Region for Clinic Treatment, CDT, and Day Treatment
In this section, the following graphs depict the net gain/(loss) per unit by program and geographic location. The purpose is to illustrate that there are differences in costs by region and that any reimbursement methodology should at least consider regional factors when determining reimbursement rates.
The results show that suburban clinics have a higher per unit deficit than all regions in all programs. Another significant finding from this analysis shows the day treatment programs in New York City show gains while deficits were incurred in the other two regions. Seven (7) out of 10 day treatment programs in New York City showed positive results.
Net Gain/(Loss) Per Unit Program and Geographic Location
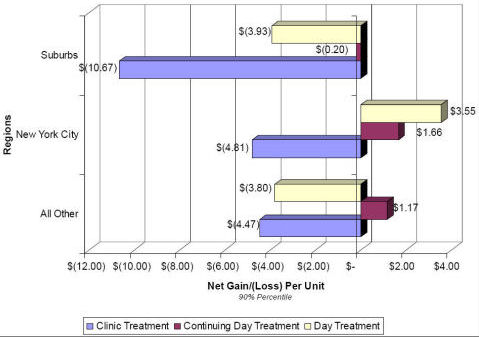
Note: The suburbs region includes the area immediately surrounding New York City, and All Other region includes any area not in New York City or surrounding suburbs.
3. Gains and Losses by Program Size and Region for Clinic Treatment, CDT, and Day Treatment
The size of a program also has considerable impact on net gains or deficits. As part of this study, all agencies and programs were categorized by size depending on the number of units reported on their CFR. The table below shows how the programs were sized.
| Units of Service | ||||||
|---|---|---|---|---|---|---|
| Small | Medium | Large | Extra Large | |||
| Program | Up to | At Least | Up to | At Least | Up to | At Least |
| Clinic | 24,999 | 25,000 | 49,999 | 50,000 | 99,999 | 100,000 |
| CDT | 49,999 | 50,000 | 99,999 | 100,000 | 199,999 | 200,000 |
| Day Treatment | 4,999 | 5,000 | 9,999 | 10,000 | 24,999 | 25,000 |
Clinic Treatment
Agencies that operated larger programs outperformed agencies with smaller or medium size programs. Although the majority of larger programs experienced deficits, overall deficits were lower than small or medium size programs. This shows that the larger the program, the greater chance the program has to remain viable. This is particular evident in New York City where the program deficits decreased as the size of the program increased from small to extra large. The suburban region showed a net gain per unit for its large providers. Please note the favorable results in the suburb region ($4.03 per unit gain) is attributable to the only large provider in that region as it received 22% of its revenue from state and local net deficit funding. The average for clinic programs was 5% of total revenue. Without this deficit funding the provider would have incurred net deficits of over $25 per unit.
Clinic Treatment
Net Gain/(Loss) Per Unit Program and Geographic Location
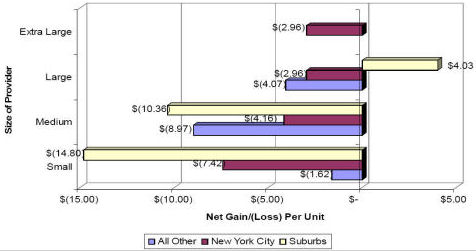
Continuing Day Treatment
The size of the program is less of a factor for continuing day treatment programs compared to clinic treatment programs. Although providers of smaller programs generated net deficits in New York City and the All Other region, providers of small programs in the suburb region generated net gains. Medium sized programs in the suburb region experienced the most favorable per unit gains followed by gains for small programs in All Other and Extra Large programs in New York City. One interesting note is that large programs were close to breakeven results in all regions and did not show per unit gains as high as extra large providers or medium size providers. The large programs received lower revenue per unit compared to small and medium size programs.
Continuing Day Treatment
Net Gain/(Loss) Per Unit by Size and Geographic Location
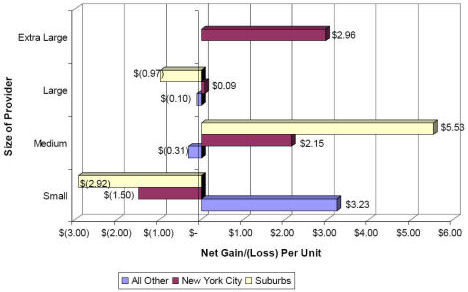
Day Treatment
The following graph shows the per unit gains and deficits for the day treatment program. The larger programs tend to show better results than the smaller programs. This is particularly true where the results for providers in the All Other region improved as the size of the program increased where the providers eventually generated a net gain in the extra large programs. Conversely, per unit gains for New York City providers diminished from medium size to extra large.
Day Treatment
Net Gain/(Loss) Per Unit by Size and Geographic Location
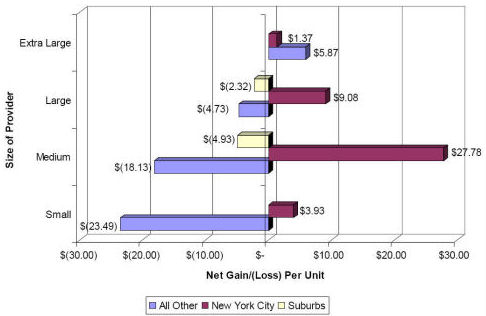
IV. Findings and Conclusions
The legislative language authorizing this study requires that it make recommendations for changes designed to ensure that the financing and reimbursement system provides for the equitable reimbursement of providers of mental health services and is conducive to the provision of effective and high quality of services. In this section we identify several major findings of the NYS OMH rate review and some reform principles on which any changes should be based. We identify many factors that should be considered in the reimbursement development process. It is important to note that the goals of quality, equity and effectiveness are not always complementary. NYS OMH and the various stakeholders should work to determine what mental health services in the state should look like and what kind of service provision and provider behavior the state wishes to promote. Methodologies can then be identified that best support the states strategy.
Overall, our findings and conclusions indicate that the current system of financing outpatient mental health services using an add-on structure should be replaced with a more equitable and more rational system of payment. The current system is outdated, under-funded and is based on a rate structure that has outlived its usefulness.
Findings
Finding 1: Reimbursements, costs and deficits vary substantially among providers.
There is substantial variance in the reimbursements providers receive and in the costs and deficits providers report. The reimbursement variance is attributable to the COPs, Non-COPs and CSP add-ons as well as the inconsistent COLA adjustment for some providers. Costs and deficits may vary for many reasons, as illustrated in Finding 5 below.
Reimbursements for services vary by hundreds of dollars:
- Continuing Day Treatment, 1 hour service for units 1-50: $12.65 to $225.32
- Clinic Regular: $49.64 to $567.25
- Day Treatment, full day - $70.93 to $332.83
Costs per unit of service vary considerably with some expenses reported thousands of dollars higher than those of other providers. When the top 5 and bottom 5 outliers are removed from the analysis, reported expenses vary over $200.
Total Expenses Per Unit
| Low | High | |
|---|---|---|
| Clinic Treatment | $ 26.30 | $ 610.28 |
| Continuing Day Treatment | $ 9.43 | $ 1,775.34 |
| Day Treatment | $ 17.68 | $ 3,382.37 |
Total Expenses Per Unit Excluding Top 5% and Bottom 5% Outliers
| Low | High | |
|---|---|---|
| Clinic Treatment | $ 53.12 | $ 292.39 |
| Continuing Day Treatment | $ 11.23 | $ 184.02 |
| Day Treatment | $ 45.02 | $ 159.09 |
Provider gains and deficits vary considerably with some providers reporting over $13 million in losses while others report over $2 million in net gains. While some of this variation may be attributable to poor data, when outliers are removed losses and gains ranged from ($1.5 million) to $2.3 million.
Finding 2: The current reimbursement system is complex and is not transparent or easily understood by providers.
Providers may receive multiple and different types of Medicaid add-on reimbursements, while other providers receive no add-ons. Providers reported that they believe the determination of who receives which add-on reimbursement seems arbitrary. In addition, cash flow in the current system is complicated by the annual COPs/Non-COPS settlement process in which providers who have been overpaid must return the funds to the state.
Finding 3: New York State collects a significant amount of detailed data from providers.
Through the CFR and ICR reports and the Patient Characteristics Survey, the State collects a significant amount of data from providers that can be utilized in the development of a reimbursement methodology and later in ongoing reimbursement updates. We understand that the CFR data is audited by NYS OMH, and the providers we met with generally felt that the CFR data provides, at least at the summary level, a realistic picture of their costs. PCG noted that providers may not be uniformly categorizing some costs or uniformly allocating administrative costs. In addition, a small number of providers are significant outliers in cost and revenue reporting, which could be an issue of poor data for some providers. Also, ICR and CFR data is sometimes difficult to compare for rate-setting purposes.
Finding 4: Providers recognize the importance of Quality. Providers are conducting various continuous quality improvement (CQI) initiatives and are measuring various outcomes.
In the stakeholder meetings and at the provider visits, providers noted the many quality initiatives that are underway across New York. Many providers are taking part in the states continuous quality improvement (CQI) initiative for which they receive additional reimbursement. CQI topics included examining no show rates and improving methods used to reduce those rates; and service documentation improvements. Providers undertake different types and different levels of quality assurance and measurement activities. Some providers have quality assurance staffs who regularly review samples of cases for quality purposes. In other agencies these functions are performed by the clinic director, or other senior staff. Some providers are documenting consumer outcomes based on various measurement scales.
Finding 5: There are several cost drivers that significantly impact clinic, CDT and day treatment costs.
As identified in the stakeholder meetings and provider visits, provider costs are impacted by many factors. These factors include but are not limited to the following:
- Geographic location: Geographic location can impact cost in a number of ways. Urban and suburban areas may have higher rent and cost of living than rural areas. Rural areas may require a provider to have multiple satellite offices spread out over a large area to allow for access in areas without public transportation.
- Client need and characteristics: Services to clients with severe and persistent mental illness (SPMI), clients who speak languages other than English, comorbidity and clients with multiple social service and safety net needs may be associated with added costs.
- Staffing models: Staffing models can substantially impact cost. Union staff often receive higher wages and greater benefits than providers with non-union staff. In areas with multiple providers competing for the same workforce, providers without unionized staff often must pay union level salaries and benefits in order to compete for the workers. Salaried workers are generally more costly than fee-for-service employees; however, salaried workers are often necessary to conduct important non-billable activities such as interactions with the state child welfare system, the judicial system, and other health care professionals utilized by the client.
- Productivity and No Shows: Productivity and no show rates are important cost components. Fee-for-service clinicians are often more productive in the sense that they see more billable consumers during their available time periods. However, fee-for-service staff are generally not available to address the non-billable activities undertaken at the clinic, as noted above. Several providers interviewed use productivity targets for all staff to improve overall productivity and revenue generation. Providers are seeking ways to address no show rates through continuous quality improvement and other internal exercises including utilizing different staff (clerical, clinicians) to telephone consumers. During the visits, providers estimated no show rates between 15% and 30%, depending on provider. In addition to CQI measures, some providers use productivity targets to encourage clinicians to extra-book clients to ensure that even with no shows the clinicians are seeing a full complement of clients on a weekly basis.
- Provider size: Smaller providers have fewer cost and revenue centers over which to allocate fixed costs such as technology, facilities, staffing and administration. As such smaller providers generally have a higher cost per unit than larger providers.
- Non-reimbursable services: Providers identified two major categories of non-reimbursable services offered: case management-type activities that could be eligible for Medicaid with proper documentation and provision of services; and non-Medicaid activities. Some programs provide case management-type activities for clients that are not billed to Medicaid for several reasons including: the client is not Medicaid eligible, the actual service is not eligible (e.g. was not provided in person and is therefore not allowable), documentation and compliance standards are not met. Providers also noted a number of non-Medicaid services that they provide to their clients in need, such as filling out benefits forms, making referrals to other agencies and programs, assisting with crisis food, housing, domestic violence, crime or other situations.
- Medicaid Managed Care: As noted in Section II, COPs add-on payments are made for Medicaid managed care services, in addition to fees paid by the MCO to the provider. Managed care rates are often considerably lower than Medicaid fee-for-service rates, and providers reported that MCO rates often do not cover the cost of providing services.
- Uninsured clients: Providers utilize a sliding fee schedule for uninsured clients. The lowest end of the fee schedule is approximately $5, creating a significant uncompensated cost for providers.
Finding 6: In total there was a $50.7 million net deficit for the agencies and programs included in this study. (346 out of approximately 455 in the New York State mental health reimbursement system).
Providers reviewed reported an overall program defict on their cost reports. The $50.7 million includes state and local net deficit funding of $25 million reimbursed to the providers included in this study. (The deficit is $75.7 million when the state and local net deficit revenue is removed.) Even when the outlier providers (10% of the top) are excluded, the remaining 90% of providers have an $11.4 million net deficit for all of the programs combined.
It is important to consider that this loss includes costs that providers may have as a result of offering non-Medicaid services, inefficiencies in the system, limits and rate inadequacies by Medicare, managed care companies and other insurance programs or other cost factors.
Finding 7: Providers are performing Medicaid outreach services to increase client enrollment in Medicaid.
Some providers perform outreach services to clients, including providing Medicaid informational material, assessing clients for Medicaid eligibility, and helping set up appointments with Medicaid eligibility workers. Medicaid outreach activities are not required by NYS OMH and are not currently billed under Medicaid administration.
Finding 8: New program funding, changes to state law, and changes to the SCHIP program will reduce the size of the un- and underinsured population.
Recent changes in funding, law and policy in New York State will impact the availability of funding to support mental health services. These changes include:
- Timothys law provides mental health parity for health insurance coverage to New Yorkers. The law requires insurers in New York that cover any type of health care to also provide coverage for mental health and substance abuse recovery. This mental health coverage must provide equal treatment to the other health care services provided under the policy. Before Timothys law, insurers could place a limit on the number of days or visits permitted for certain mental health diagnosis and treatments.
- NYS will be halving the number of un- and underinsured through the elimination of barriers to SCHIP for children and families who are currently eligible but not enrolled.
- NYS plans to expand Child Health Plus to cover children in families up to 400 percent of the federal poverty level. New York als o plans to simplify its recertification process for Medicaid, making it easier for families to make sure they maintain coverage.
Timothys law, Clinic Plus, the expansion of Child Health Plus and also the removal of administrative obstacles to Family health Plus will increase the amount of private insurance and Medicaid/State Childrens Health Insurance Plan coverage available to mental health clients and should decrease the pressure of the uninsured population on mental health providers.
Finding 9: Providers cited difficulty in recruiting appropriately licensed staff, particularly in specialty areas.
Several providers noted that they have a difficult time recruiting appropriately licensed staff, particularly in specialty areas such as childrens psychiatry and bilingual staff. Providers cited low salaries/salary competition, tough work environments and fewer licensed providers than actual demand as impacting their ability to recruit and retain staff. In some cases providers noted that they are not able to bill managed care for services because the MCOs have different, higher standards of licensure than New York State Medicaid and they are unable to retain the necessary staff. Recruiting staff that are bilingual to address the changing mental health population was identified as very difficult. In one rural region the provider identified salary competition with the state jobs in the region severely limited their ability to retain staff. These problems are exacerbated due to the fact that rates have not kept pace with increasing costs.
Finding 10: The existing reimbursement system has not kept up with changes in the delivery system. It does not have a process in place to adequately adjust the baseline from which funding add-ons were originally calculated.
The initial funding calculations that determined the amount of the provider-specific add-on payments were largely based on the overall financial performance and funding sources of the provider in the 1989 base year and its designation as either a COPs or Non-COPs provider. These initial calculations have remained fairly static since 1989, with only minor adjustments in some places. Over an 18 year period, inequities among like providers have become significant.
Finding 11: Providers indicate that the distinctions differentiating providers have narrowed since the original funding formula was developed.
Over the years, services offered by various providers have become more comparable, consumers served and payer types have become more consistent across providers. As a result, anecdotal evidence suggests that the distinctions that originally separated some types of providers have disappeared.
When the COPS reimbursement structure was established originally, the focus of the program was to serve a broad consumer population. Over the years, however, Non-COPs agencies have expanded their services to comparable populations and utilizing similar payer mix. At our stakeholder meetings and provider visits, both COPs and Non-COPs providers said they do not believe there is any material difference in the services provided, regardless of their designation. Since 1991, new regulations have been implemented requiring Non-COPs providers to offer many of the mandated COPs services (including seeing a consumer within 5 days of hospital or emergency room discharge). As a result of these changes, anecdotal evidence suggests that the distinctions that originally separated the COPs providers from the Non-COPs have disappeared.
Finding 12: If the resources in the existing system were redistributed, a significant increase in the clinic base rate could be financed.
The current rate structure roughly reflects the average cost of services but is disproportionately distributed. Hypothetically an average per visit increase of approximately $70 could be supported if all current add-ons were evenly distributed. This would not take into consideration variations in types of services and length of visits. Such redistribution merely demonstrates the reinvestment possibilities that could be accommodated across the system generally.
Finding 13: Low Medicaid managed care reimbursement and the subsequent addition of the COPs add-on managed care reimbursement has eroded the financial health of providers and created a duplicative, costly state payment mechanism.
Individual providers must negotiate the Medicaid managed care rate with the managed care organization. For COPs providers, the COPs add-on amount is paid separately to the provider for outpatient services provided to a Medicaid managed care consumer. This system exacerbates financial strain on the system in several ways.
- Providers do not feel that they are in a strong bargaining position and as such do not negotiate Medicaid managed care rates that cover their costs. Providers indicated that a below cost payment from the managed care organizations was better than failing to negotiate any agreement which would lead to no payment for managed care clients served.
- The continued state payment of the COPs add-on for Medicaid managed care clients subsidizes the low Medicaid managed care rates and provides a further disincentive for negotiating more competitive Medicaid managed care rates.
- This method of paying for managed care clients out of two state sources Medicaid managed care capitated rates and Medicaid add-ons to the providers diminishes any savings the state may obtain through the existence of the capitation.
Key Considerations for Alternate Reimbursement Methods
There are many factors that the state should consider when developing a reimbursement methodology, not the least of which is a broader health care policy for the State of New York. No changes to the reimbursement methodology for outpatient mental health services should be done without considering the states overall health care policy goals.
The weight of these factors will depend on the states goals and objectives.
- Provider specific reimbursement rates are often equitable when based on individual provider expenses. However, they are not efficient from a state management and rate maintenance perspective.
- A cost-based reimbursement structure that reimburses full cost of service may support quality initiatives and equity objectives. However, it may not encourage providers to be efficient, to seek cost savings, or to obtain third party payments.
- A reimbursement methodology that establishes a set fee based on reasonable cost standards rather than actual costs can support equitable provider reimbursement and can be designed to encourage cost and service efficiency.
- Annual inflation adjustments and regular rate rebasing to maintain adequate reimbursement amounts can help to support quality and effectiveness of services. Regular, scheduled adjustments and rebasing also provide rate continuity for provider planning and cash flow purposes.
- Utilizing national service codes (HCPC, CPT) in state billing processes supports uniformity in service provision, documentation and reimbursement. It also supports providers as they seek third party reimbursement from sources other than Medicaid.
- Incentives can be built into the reimbursement methodology to support quality, effectiveness and equity. For example, factors can encourage providers to seek third party payments or to strive for certain performance outcomes. As one example, Medicare is implementing a payment methodology to support quality outcomes. A first step in obtaining quality outcomes is to collect various quality/outcome data elements. Medicare is paying an additional amount to providers who collect and submit this data to CMS.
- Any substantial changes to the New York State reimbursement system will likely require a State Plan Amendment and CMS approval.
- Changing the current system without accounting for the uninsured may result in insufficient funding within the system for those without insurance who providers must serve.
- Some states use a Medicaid billing structure that allows providers to identify and bill for activities that may not meet the federal Medicaid guidelines. These activities are coded separately in the billing and are paid with state-only funds.
Alternate Reimbursement Methodologies
The following table provides a brief overview of some standard rate setting methodologies utilized by other states and that NY may wish to consider in designing changes to the states Medicaid reimbursement system.
| Rate Setting Methodology/Component | Description |
|---|---|
| Fee for Service Rates | Rates paid to the provider on a per service basis. Providers are paid for each service delivered. Fee for service rates as a general category may be fixed fees, prospective payment rates, or interim payments with a cost settlement process. They are based on market averages and may lead to cost efficiency. |
| Cost Based Rates | Cost based reimbursements are based on the cost of the care provided to a consumer as opposed to a predetermined amount. Cost based reimbursement rates are calculated using facility-specific/provider specific costs, and may lead to inefficiencies. |
| Rate Settlement Process | The state sets an interim rate for a service and then conducts a cost-settlement at the end of year and determines whether services provided cost more or less during the year than the interim rates paid during the year. The provider usually receives a settlement payment if actual costs were higher, or is responsible for a repayment if actual costs were lower. |
| Prospective Payment Rates | Prospective payment rates are fees that are set prior to the year in which they are paid and are not reconciled with actual costs through a cost settlement process. |
| Medicare Rates | Another rate setting methodology is to tie Medicaid rates to Medicare rates for the same services. This provides less state control over the rate that is set but is relatively easy to manage. If the state covers services that Medicare does not pay for, additional rates may need to be set. |
| Per Diem Rates | Per diem reimbursement is a fee paid for a day of care, regardless of the number of services actually provided during the day. Per diem rates are most commonly used in inpatient settings but are also used for residential treatment and emergency mental health services. |
| Pay for Performance | Pay for a performance can be used to supplement any type of reimbursement rate. It requires statistically valid measures of quality and consensus among providers that such payments are proper and equitable incentives for continuous quality improvement. |
| Capitated Rates | Capitated Rates reimburses providers based on a per member, per month basis. Payments are made at the same level, whether or not the member receives services during the month. Capitated rates stand in contrast to fee-for-service rates, where payments are based on the actual units of service provided. A case rate is similar to a capitated rate, except that case rates typically vary by type of case and are not paid until the individual receives certain services during the month. |
| Quality Incentives | State can establish quality incentives (in line with the pay for performance methodology). As an example, the federal government is attempting to pay for quality measurement in the Medicare system. CMS Medicare will pay an additional 1.5% to physicians who report data on certain quality measures. CMS is focused on evidence-based quality measures such as how often physicians prescribe certain drugs. A similar program could be implemented for Medicaid rates. |
Conclusions
Based on the results of this study, PCG has concluded that the current system of financing and reimbursement should be overhauled. The current methodology has been in place for nearly two decades. Providers universally describe the system as broken, and the state appears poised for a change. As New York State moves forward in restructuring its Medicaid reimbursement methodology for outpatient mental health services, there are several items the state must consider.
First, changes to the system should be guided by the physical and behavioral needs of Medicaid enrollees and research about the most effective models of care. Any restructuring should be done with the goal of creating a system that is more equitable across the provider community and aligned with the states mental health and overall health care goals.
Second, New York State should consider how outpatient mental health services fit in to the states overall health care policy objectives. This study focused on one small piece of the Medicaid reimbursement puzzle, but any changes must be made with the entire system in mind.
Third, the state should create a system that is based on validated, consistent and up-to-date data. New York State already collects a significant amount of data that could be useful in constructing a new reimbursement method. However, some additional training would allow for greater uniformity in the data. By ensuring consistent data collection and using the most current data available, the State of New York could create a reimbursement system that is based on current costs.
Fourth, the state can also use this opportunity to tie the reimbursement methodology more closely to the mission and goals of NYS OMH. The current system does acknowledge many policy goals, like serving priority populations and low-income consumers, but it could go further. NYS OMH could use this opportunity to bring all the various stakeholders in outpatient mental health services together to more specifically define the systems goals and objectives.
Additionally, the new system should also give due consideration to the following reform principles and ideas for redistribution of resources:
- Medicaid payments should address the reasonable and necessary cost of providing services to Medicaid enrollees.
- Medicaid payments must take into account the multiple needs of individuals requiring mental health services, including integration with general health care, substance abuse and mental retardation services.
- The payment method should be built on an econometrically sounds basis, taking into account differences in provider service type, service intensity, geography and volume.
- Financial incentives must be aligned across licenses and settings.
- Add-on payments should be eliminated. The savings should be reinvested into a new payment structure that takes case mix into consideration and that would apply to all providers.
- NYS OMH should consider the use of more appropriate, HIPPA-compliant codes, where the type and amount of services delivered are consistent with CPT-4 definitions.
- Further consideration should be given to the development of incentive payments that tie to measurable indicators of quality such as outcomes, accountability, individualized services, and overall responsibility for the client.
- The state needs to recognize the need for indigent care and should consider developing an Indigent Care Pool, which would address issues related to net deficit financing and wrap-around services. Indigent care payments to providers should be based on the relative percentage of uninsured patients in their caseload.
V. References
We reviewed numerous documents during our review of the New York mental health provider rate system. We received documents from all of the providers that we visited as well as the following reports from NYS OMH and stakeholders:
- Summary Coalition Proposal for Restructuring Mental Health Clinic Services and reimbursement
- NY Statewide Comprehensive Mental Health Plan 2006-2010
- NYS Conference of Local Mental Hygiene Directors Technical Assistance Project-CSP
- NYS Conference of Local Mental Hygiene Directors Technical Assistance Project-COPs
- NYS Consolidated Budget and Claiming Manual
- A Review of the Efficiency of Freestanding Clinics, May 1996, OMH Rate Review\cqc clinic rate report from 1996.htm
- Patient Characteristic File
- Outpatient Study-Access Database
- Medicaid and CFR County Codes
- ICR data
- CFR data
- HCPCS/CPT-OMH Care Service Crosswalk
- County Codes by Region
- Medicaid Service Coordination
- OPTS State Savings Summary, Rate Schematic, Tabs Requirement, Program Services, Revenue,
- DHHS Audit of OMRDD Medicaid Service Coordination Program
- MSC Vendor Manual in effect during audit period
- MSC Vendor Contract Agreement
- OMRDD Regulations related to MSC
- Approved MSC State Plan
- OMRDDs Provider Agreement with NYS Dept of Public Health to provide MSC
VI. Appendix
Overview of Data Analyzed
Agency / Program Size
The size of the agency / program is based on total units reported on the CFR data. The agency / program size was divided into four categories; small, medium, large and extra large. The chart below is a breakdown of the criteria for program size for clinic, continuing day treatment and day treatment programs:
| Units of Service | ||||||
|---|---|---|---|---|---|---|
| Small | Medium | Large | Extra Large | |||
| Program | Up to | At Least | Up to | At Least | Up to | At Least |
| Clinic | 24,999 | 25,000 | 49,999 | 50,000 | 99,999 | 100,000 |
| CDT | 49,999 | 50,000 | 99,999 | 100,000 | 199,999 | 200,000 |
| DT | 4,999 | 5,000 | 9,999 | 10,000 | 24,999 | 25,000 |
The following chart shows the number of agencies for each program size. There are generally more smaller programs than medium programs and more medium programs than large or extra large programs. Small programs represent 158 out of 215 (40%) of all clinic treatment programs while large programs represented 16% of all clinic programs.
| Number of Agencies/Programs | |||||
|---|---|---|---|---|---|
| Program | Small | Medium | Large | Extra Large | Total |
| Clinic | 158 | 45 | 10 | 2 | 215 |
| CDT | 65 | 20 | 12 | 4 | 101 |
| DT | 8 | 8 | 8 | 6 | 30 |
| Total | 231 | 73 | 30 | 12 | 346 |
The percentage of provider in each program size category by program:
| Number of Units by Percent | |||||
|---|---|---|---|---|---|
| Program | Small | Medium | Large | Extra Large | Total |
| Clinic | 40.1% | 35.8% | 16.0% | 8.1% | 100.0% |
| CDT | 27.1% | 21.4% | 25.8% | 25.7% | 100.0% |
| DT | 5.3% | 14.1% | 29.4% | 51.2% | 100.0% |
| Total | 31.3% | 26.7% | 22.2% | 19.8% | 100.0% |
Overview of Regions by Program Size Clinic Treatment
Programs operating in the New York City region represent 41% of all clinic treatment programs while the New York Suburbs represent 15% of all programs. All other programs in the State of New York make up the remaining 44% of programs.
| Number of Agencies/Programs | |||||
|---|---|---|---|---|---|
| Program | Small | Medium | Large | Extra Large | Total |
| New York City | 57 | 22 | 7 | 2 | 88 |
| Suburbs | 25 | 7 | 1 | - | 33 |
| All Other | 76 | 16 | 2 | - | 94 |
| Total | 158 | 45 | 10 | 2 | 215 |
A total of 73% of the programs are considered small compared with 21% for medium programs, 5% for large programs and 1% for extra large programs.
| Number of Agencies/Programs | |||||
|---|---|---|---|---|---|
| Program | Small | Medium | Large | Extra Large | Total |
| New York City | 26.5% | 10.2% | 3.3% | 0.9% | 40.9% |
| Suburbs | 11.6% | 3.3% | 0.5% | 0.0% | 15.3% |
| All Other | 35.3% | 7.4% | 0.9% | 0.0% | 43.7% |
| Total | 73.5% | 20.9% | 4.7% | 0.9% | 100.0% |
| Number of Units | |||||
|---|---|---|---|---|---|
| Program | Small | Medium | Large | Extra Large | Total |
| New York City | 566,330 | 773,214 | 492,474 | 339,931 | 2,171,949 |
| Suburbs | 292,987 | 221,489 | 51,697 | - | 566,173 |
| All Other | 831,820 | 513,914 | 132,039 | - | 1,477,773 |
| Total | 1,691,137 | 1,508,617 | 676,210 | 339,931 | 4,215,895 |
Small agencies represent 74% of the programs and generate 40% of the units.
| Number of Units by Percent | ||||||||
|---|---|---|---|---|---|---|---|---|
| Program | Small | Medium | Large | Extra Large | Total | |||
| New York City | 13.4% | 18.3% | 11.7% | 8.1% | 51.5% | |||
| Suburbs | 6.9% | 5.3% | 1.2% | 0.0% | 13.4% | |||
| All Other | 19.7% | 12.2% | 3.1% | 0.0% | 35.1% | |||
| Total | 40.1% | 35.8% | 16.0% | 8.1% | 100.0% | |||
Overview of COPs and Non-COPs providers by Program Size Clinic Treatment
COPs providers represent 81% of the programs, 82% of the units rendered and 90% of Medicaid revenues.
| Number of Agencies/Programs | |||||
|---|---|---|---|---|---|
| Program | Small | Medium | Large | Extra Large | Total |
| COPs | 126 | 38 | 7 | 2 | 173 |
| Non-COPs | 32 | 7 | 3 | - | 42 |
| Total | 158 | 45 | 10 | 2 | 215 |
| Number of Agencies/Programs | |||||
|---|---|---|---|---|---|
| Program | Small | Medium | Large | Extra Large | Total |
| COPs | 58.6% | 17.7% | 3.3% | 0.9% | 80.5% |
| Non-COPs | 14.9% | 3.3% | 1.4% | 0.0% | 19.5% |
| Total | 73.5% | 20.9% | 4.7% | 0.9% | 100.0% |
| Number of Units | |||||
|---|---|---|---|---|---|
| Program | Small | Medium | Large | Extra Large | Total |
| COPs | 1,353,193 | 1,278,953 | 470,672 | 339,931 | 3,442,749 |
| Non-COPs | 337,944 | 229,664 | 205,538 | - | 773,146 |
| Total | 1,691,137 | 1,508,617 | 676,210 | 339,931 | 4,215,895 |
| Number of Units by Percent | |||||
|---|---|---|---|---|---|
| Program | Small | Medium | Large | Extra Large | Total |
| COPs | 32.1% | 30.3% | 11.2% | 8.1% | 81.7% |
| Non-COPs | 8.0% | 5.4% | 4.9% | 0.0% | 18.3% |
| Total | 40.1% | 35.8% | 16.0% | 8.1% | 100.0% |
| Medicaid Revenue Reported | |||||
|---|---|---|---|---|---|
| Type | Small | Medium | Large | Extra Large | Total |
| COPs | $127,481,773 | $104,781,350 | $35,202,544 | $25,241,477 | $292,707,144 |
| Non-COPs | $11,200,276 | $9,141,391 | $11,101,777 | $0 | $31,443,444 |
| Total | $138,682,049 | $113,922,741 | $46,304,321 | $25,241,477 | $324,150,588 |
| Medicaid Revenue Reported as a Percentage of All Medicaid Revenues | |||||
|---|---|---|---|---|---|
| Program | Small | Medium | Large | Extra Large | Total |
| COPs | 39.3% | 32.3% | 10.9% | 7.8% | 90.3% |
| Non-COPs | 3.5% | 2.8% | 3.4% | 0.0% | 9.7% |
| Total | 42.8% | 35.1% | 14.3% | 7.8% | 100.0% |
Overview of Article 28 and Article 31 Provider Types by Program Size Clinic Treatment
Article 31 providers represent 82% of all providers and generate 81% of the Medicaid revenues.
| Number of Agencies/Programs | |||||
|---|---|---|---|---|---|
| Program | Small | Medium | Large | Extra Large | Total |
| Article 28 | 26 | 10 | 4 | - | 40 |
| Article 31 | 132 | 35 | 6 | 2 | 175 |
| Total | 158 | 45 | 10 | 2 | 215 |
| Number of Agencies/Programs | |||||
|---|---|---|---|---|---|
| Program | Small | Medium | Large | Extra Large | Total |
| Article 28 | 12.1% | 4.7% | 1.9% | 0.0% | 18.6% |
| Article 31 | 61.4% | 16.3% | 2.8% | 0.9% | 81.4% |
| Total | 73.5% | 20.9% | 4.7% | 0.9% | 100.0% |
| Number of Units | |||||
|---|---|---|---|---|---|
| Program | Small | Medium | Large | Extra Large | Total |
| Article 28 | 308,507 | 309,306 | 308,097 | - | 925,910 |
| Article 31 | 1,382,630 | 1,199,311 | 368,113 | 339,931 | 3,289,985 |
| Total | 1,691,137 | 1,508,617 | 676,210 | 339,931 | 4,215,895 |
| Number of Units by Percent | |||||
|---|---|---|---|---|---|
| Program | Small | Medium | Large | Extra Large | Total |
| Article 28 | 7.3% | 7.3% | 7.3% | 0.0% | 22.0% |
| Article 31 | 32.8% | 28.4% | 8.7% | 8.1% | 78.0% |
| Total | 40.1% | 35.8% | 16.0% | 8.1% | 100.0% |
| Medicaid Revenue Reported | |||||
|---|---|---|---|---|---|
| Type | Small | Medium | Large | Extra Large | Total |
| Article 28 | $22,736,464 | $13,627,574 | $26,466,762 | $0 | $62,830,800 |
| Article 31 | $115,945,585 | $100,295,167 | $19,837,559 | $25,241,477 | $261,319,788 |
| Total | $138,682,049 | $113,922,741 | $46,304,321 | $25,241,477 | $324,150,588 |
| Medicaid Revenue Reported as a Percentage of All Medicaid Revenues | |||||
|---|---|---|---|---|---|
| Program | Small | Medium | Large | Extra Large | Total |
| Article 28 | 7.0% | 4.2% | 8.2% | 0.0% | 19.4% |
| Article 31 | 35.8% | 30.9% | 6.1% | 7.8% | 80.6% |
| Total | 42.8% | 35.1% | 14.3% | 7.8% | 100.0% |
- NYS OMH Regulations, Part 592 Comprehensive Outpatient Programs
- NYS OMH Regulations, Part 587 Operation of Outpatient Programs
- Column A- For programs operated in Bronx, Kings, New York, Queens, Richmond, Nassau, Suffolk, Putnam, Rockland and Westchester counties:
- Column B- For programs operated in Allegheny, Cattaraugus, Chautauqua, Chemung, Erie, Genesee, Livingston, Monroe, Niagara, Ontario, Orleans, Schuyler, Seneca, Steuben, Tioga, Tompkins, Wayne, Wyoming and Yates counties
- Column C- For programs operated in Broome, Cayuga, Chenango, Clinton, Cortland, Delaware, Essex, Franklin, Fulton, Hamilton, Herkimer, Jefferson, Lewis, Madison, Montgomery, Oneida, Onondaga, Oswego, Otsego, St. Lawrence, Albany, Columbia, Dutchess, Greene, Orange, Rensselaer, Saratoga, Schenectady, Schoharie, Sullivan, Ulster, Warren and Washington counties
- Column A- Operated in Bronx, Kings, New York, Queens and Richmond counties.
- Column B - Operated in areas other than Bronx, Kings, New York, Queens and Richmond counties.
- For programs operated in Bronx, Kings, New York, Queens, Richmond, Nassau, Suffolk, Putnam, Rockland and Westchester counties
- For programs operated in Allegheny, Cattaraugus, Chautauqua, Chemung, Erie, Genesee, Livingston, Monroe, Niagara, Ontario, Orleans, Schuyler, Seneca, Steuben, Tompkins, Wayne, Wyoming and Yates counties
- For programs operated in Broome, Cayuga, Chenango, Clinton, Cortland, Delaware, Essex, Franklin, Fulton, Hamilton, Herkimer, Jefferson, Lewis, Madison, Montgomery, Oneida, Onondaga, Oswego, Otsego, St. Lawrence, Tioga, Albany, Columbia, Dutchess, Greene, Orange, Rensselaer, Saratoga, Schenectady, Schoharie, Sullivan, Ulster, Warren and Washington counties:
- Please note that Article 28 providers have an option of submitting financial and statistical information on the CFR or the Institutional Cost Report (ICR). Those service providers that submitted an ICR and not a CFR are not part of this study because variations in how data is reported does not allow an appropriate comparison of costs, units and revenue.
- Some variations in per unit analysis may be attributable to providers inaccurately reporting visits rather than as hours in the CDT and day treatment units.